Background
Sector Roadmaps to Nature Positive
In 2022, WBCSD launched a series of sector Roadmaps to Nature Positive. We developed them through a collaborative process, bringing together peers from the same sector or economic system, to define a shared agenda and the activities that will accelerate credible nature-related action and accountability.
To date, we have developed sector Roadmaps for agri-food, the built environment, energy, forest products and pharmaceuticals. The Chemicals sector Roadmap is under development.
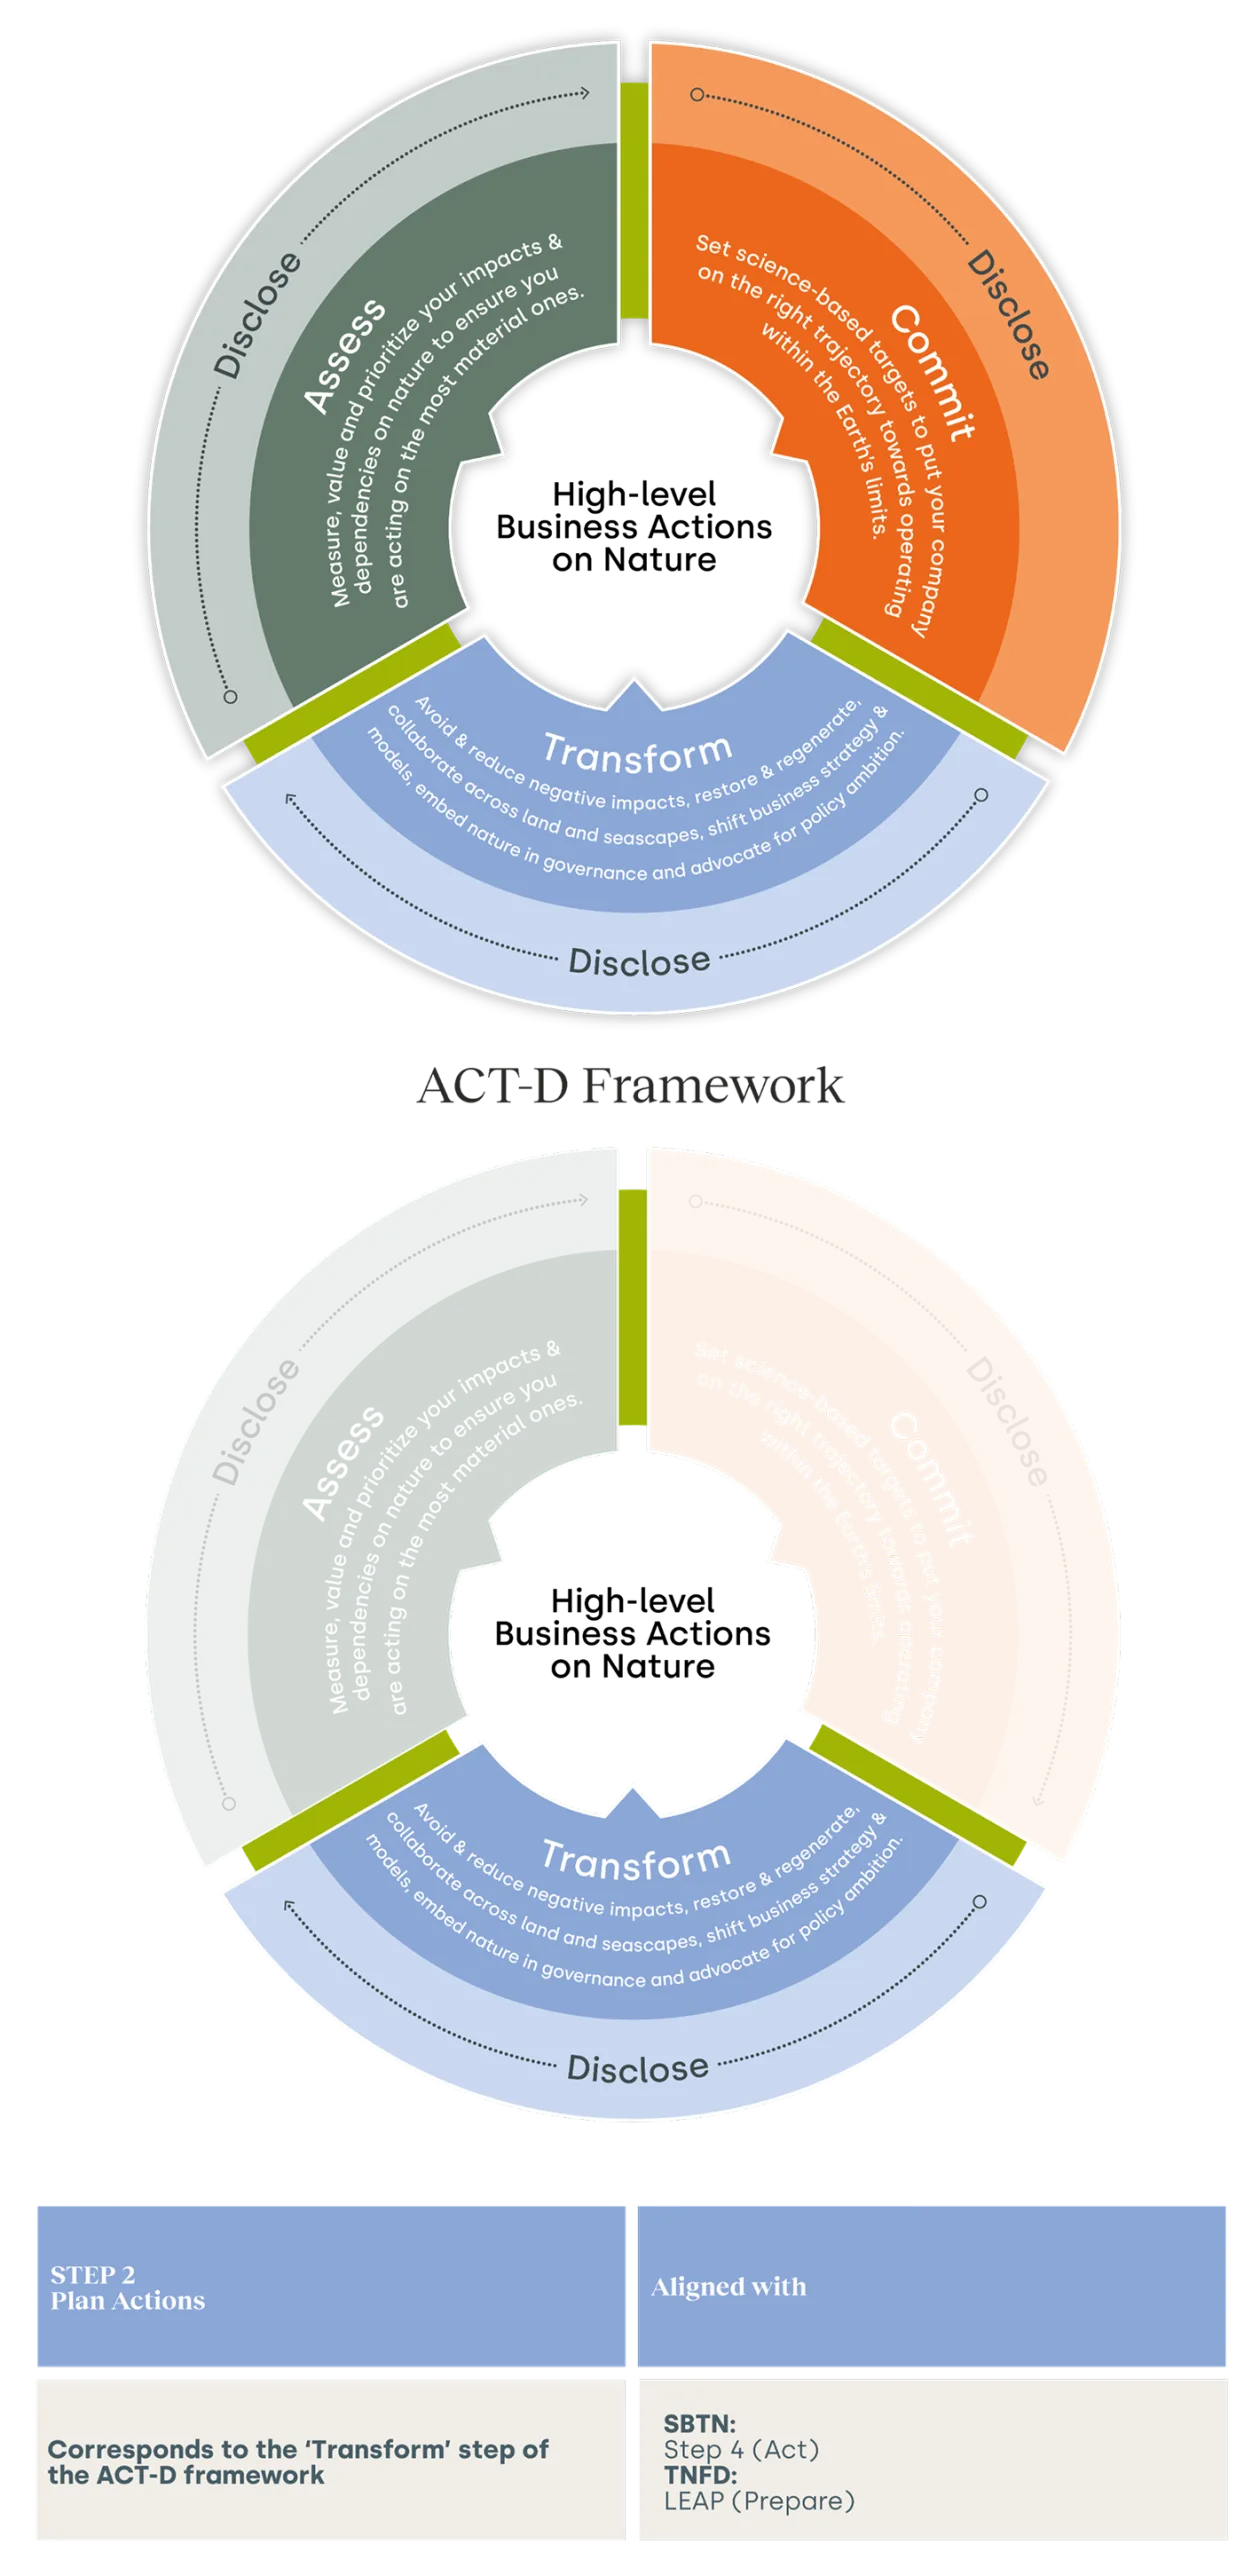
Business for Nature’s ACT-D High-level Business Actions on Nature framework (Assess, Commit, Transform and Disclose) provides the foundation for the Roadmaps. It guides businesses through available tools, frameworks and initiatives to assess their dependencies and impacts on nature, commit to ambitious targets, transform their practices and disclose relevant nature-related information. See diagram below.
The ACT-D Framework – High-level Business Action on Nature
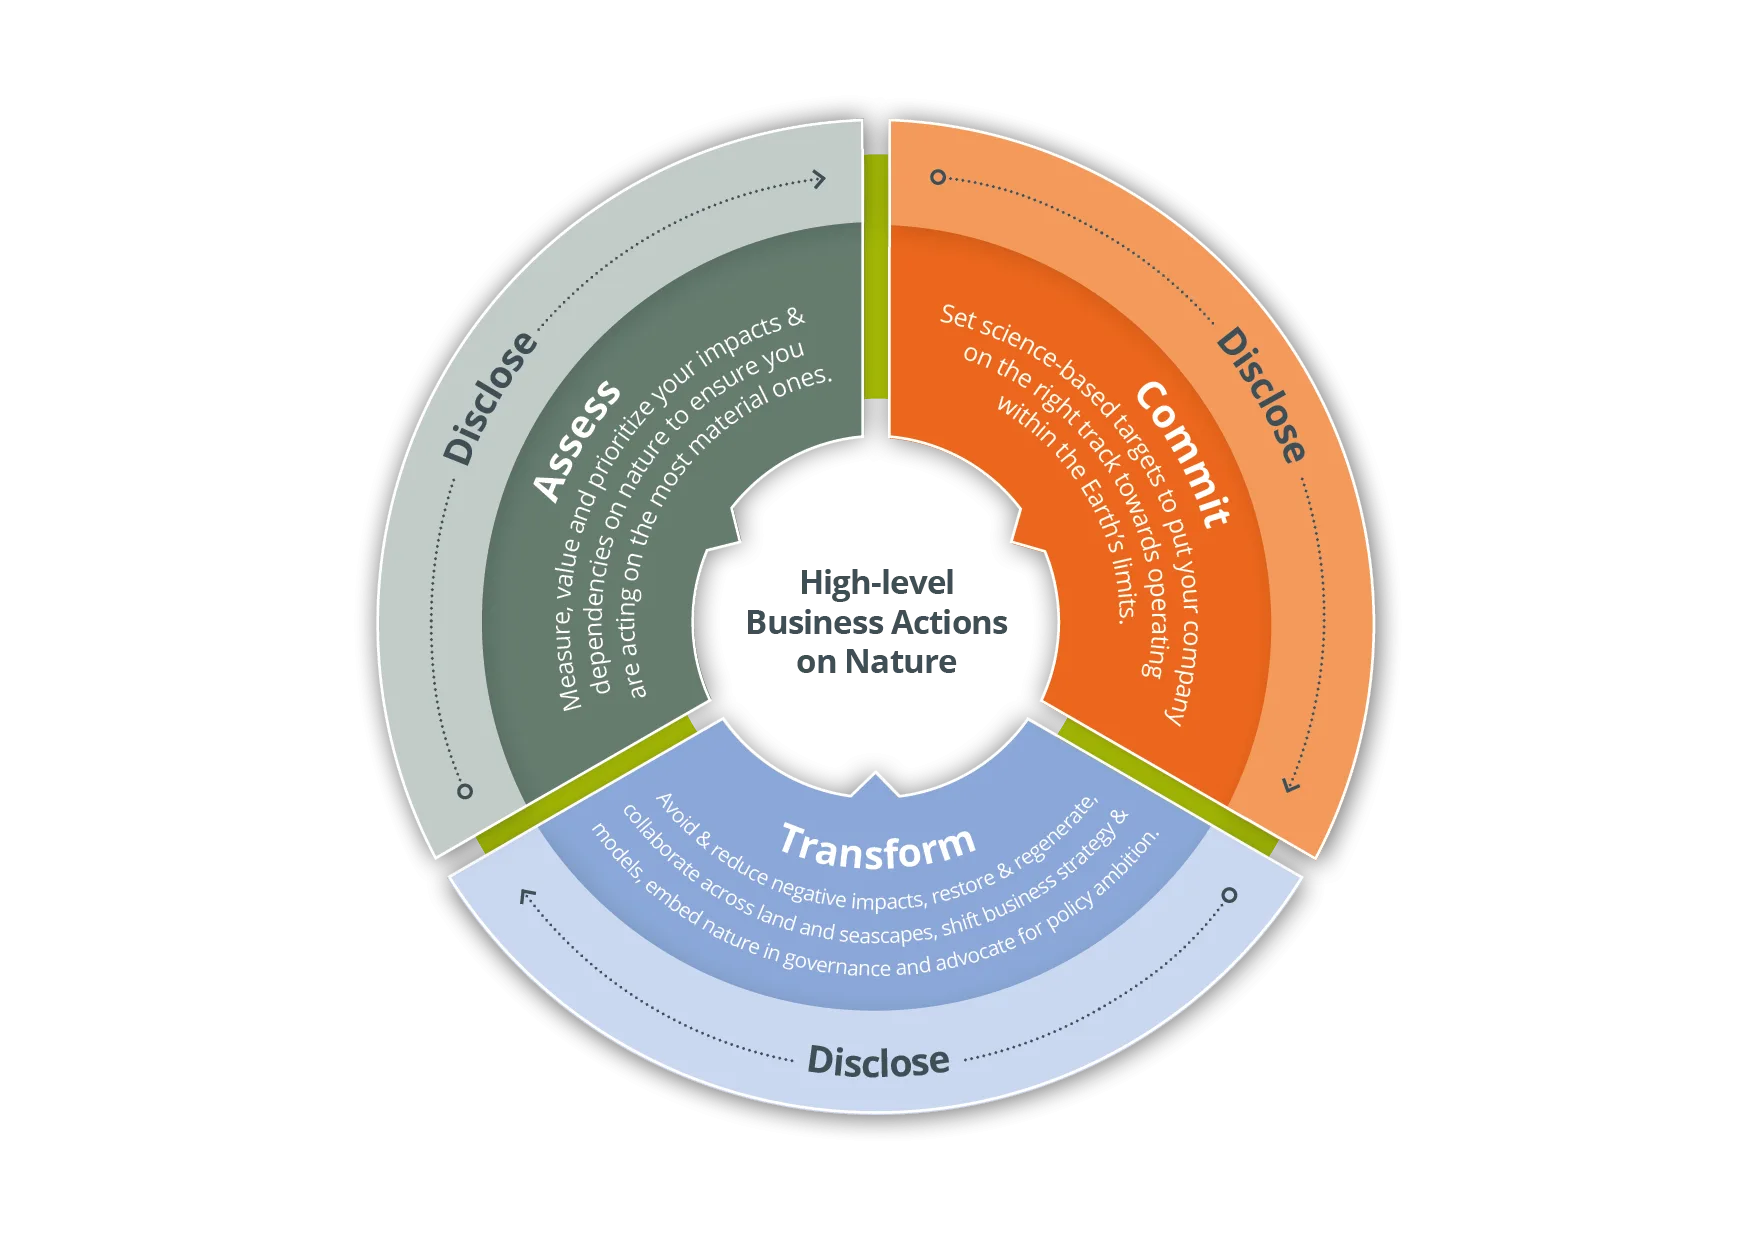
Developed through a collaboration between WBCSD, Business for Nature, the Capitals Coalition, the Science Based Targets Network, the Taskforce on Nature-related Financial Disclosures, the World Economic Forum and the World Wildlife Fund.
The Methodology for the Nature Action Portal follows the three-step journey:
STEP 1: Explore dependencies, impacts, risks and opportunities
STEP 2: Plan action
STEP 3: Choose metrics
For each step, this document outlines the main elements of the methodology following the ACT-D framework and explains how it connects to the Science Based Targets Network (SBTN) and Taskforce on Nature-related Financial Disclosures (TNFD) guidance.
STEP 1: Explore dependencies, impacts, risks & opportunities
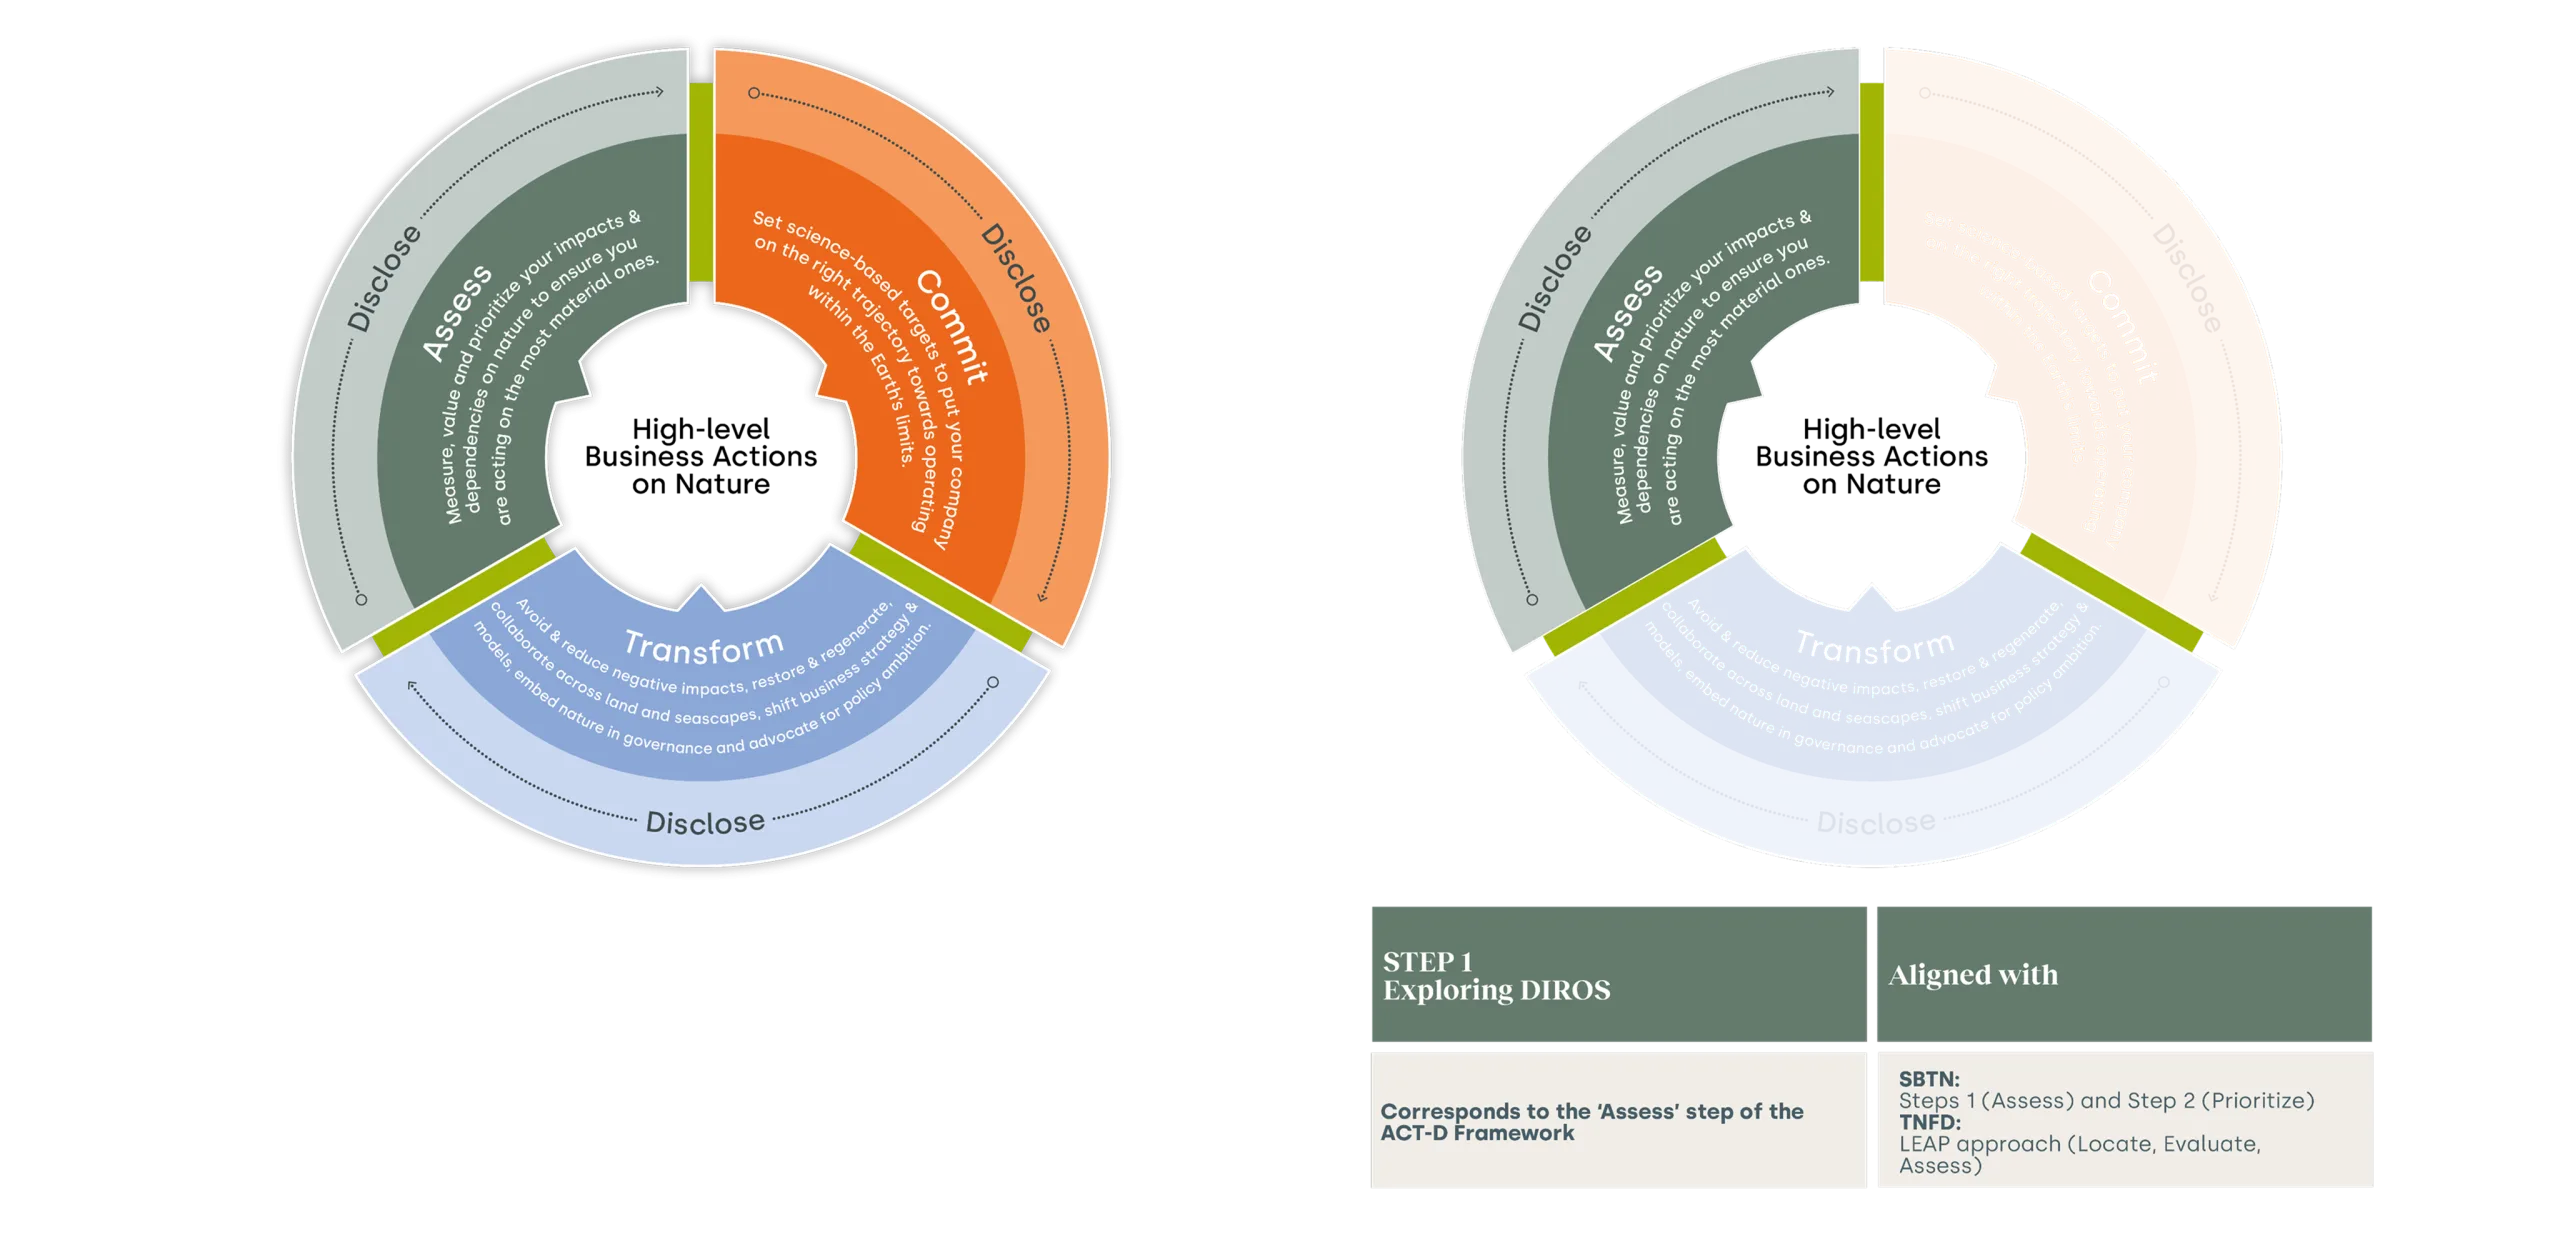
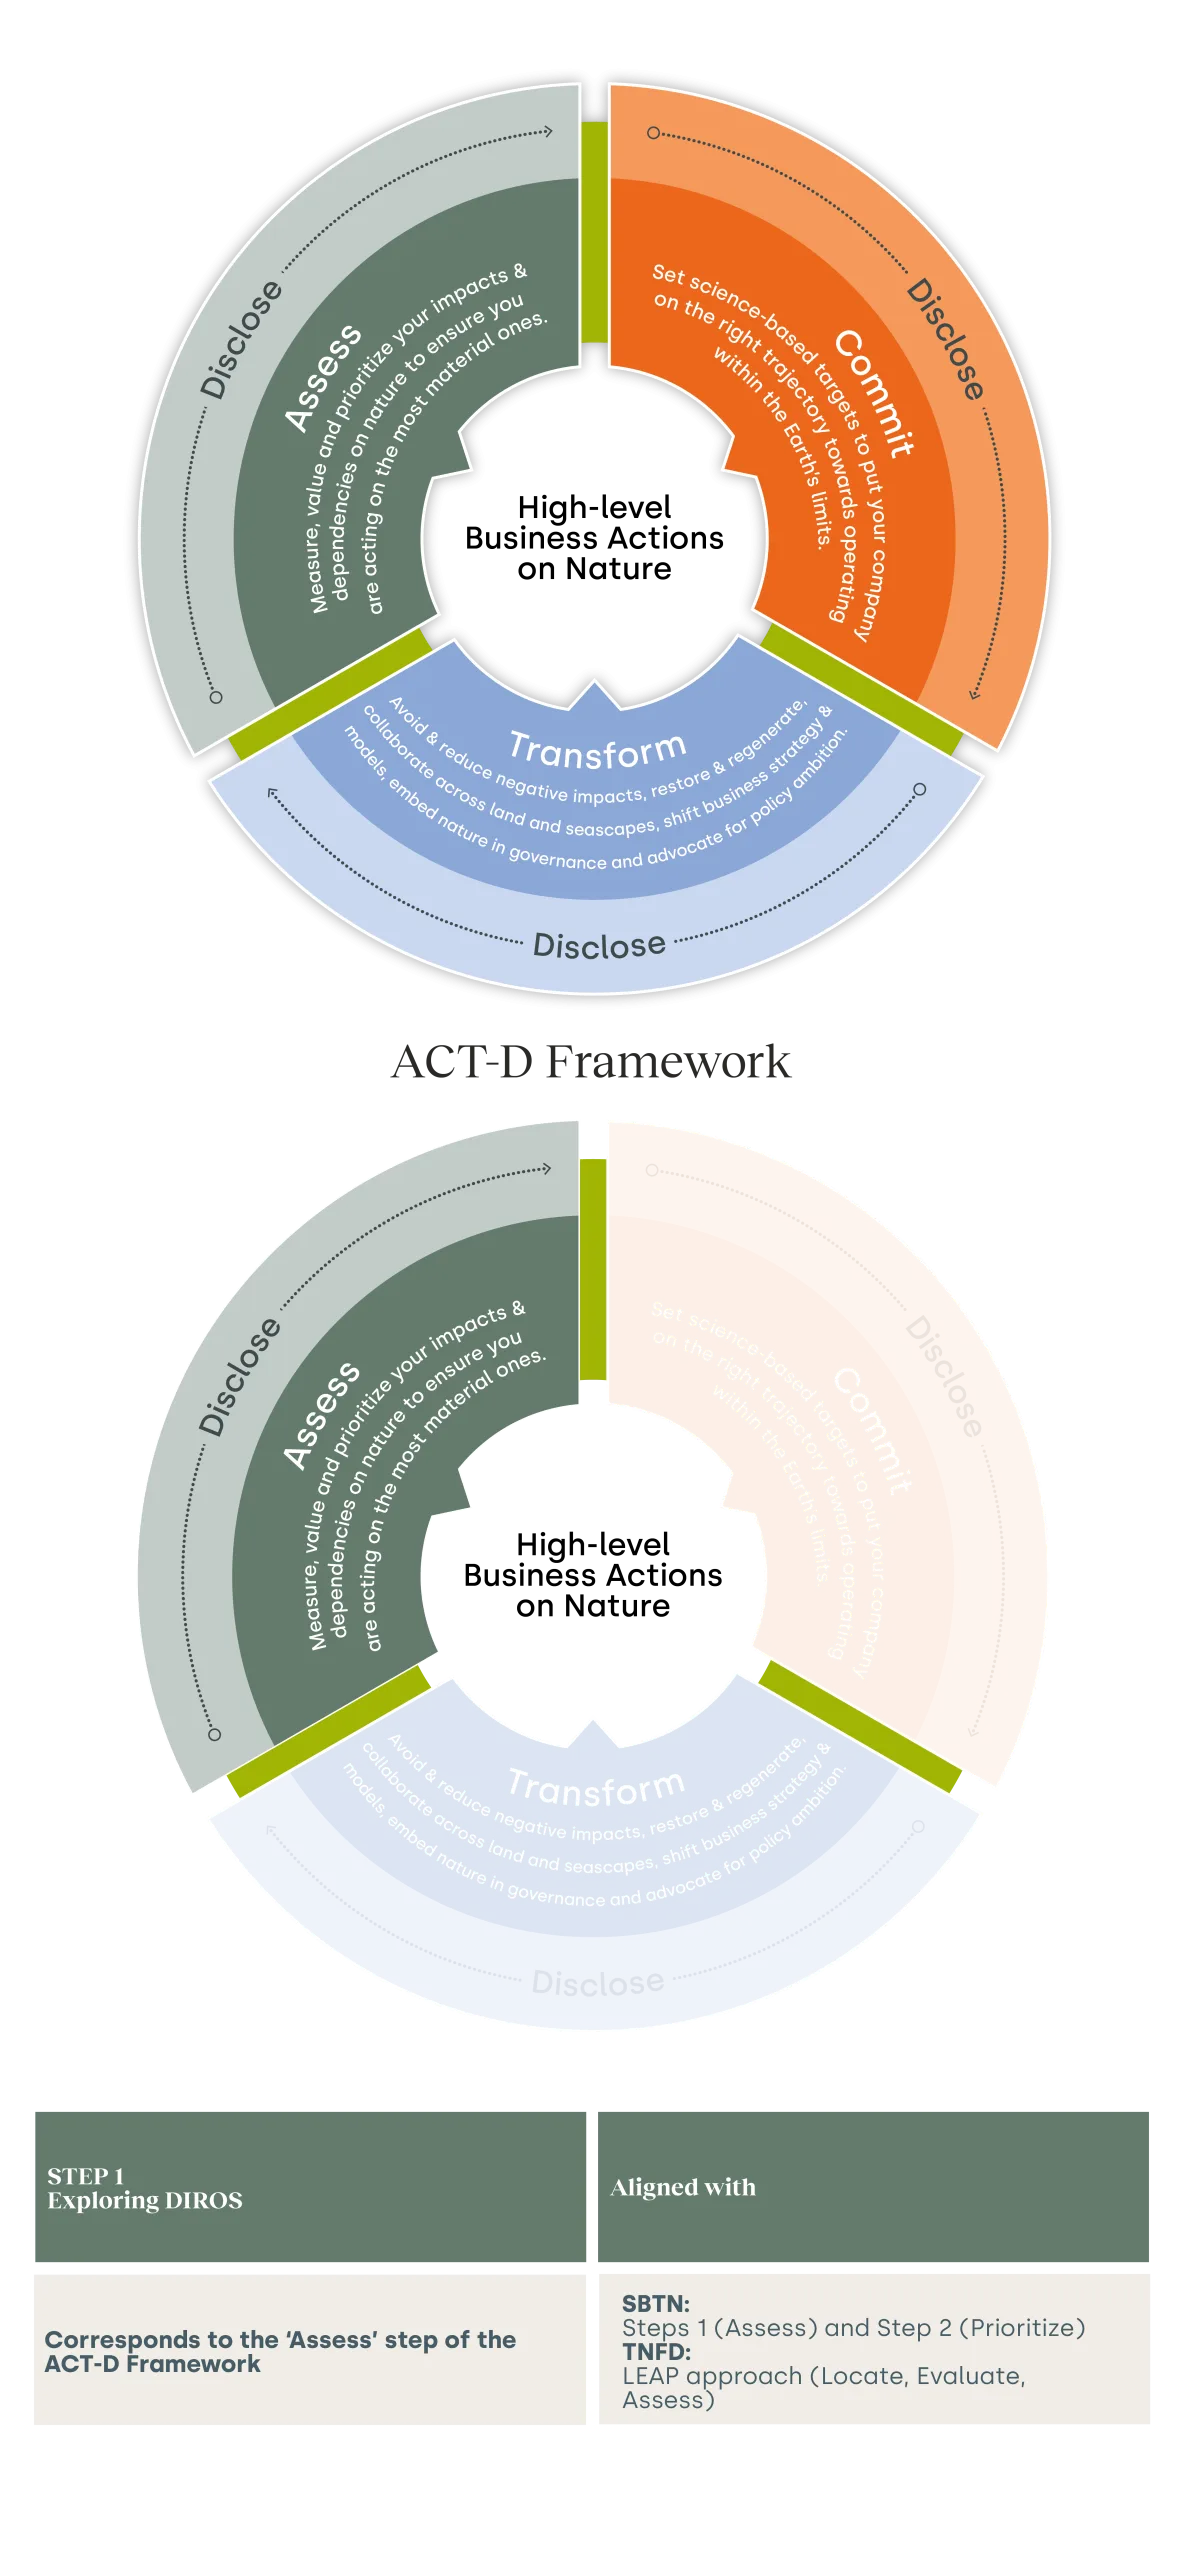
The ACT-D Framework and STEP 1: Exploring dependencies, impacts, risks & opportunities (DIROs)
Mapping the sector value chain
Each sector roadmap starts with a mapping of the sector’s value chain to provide a clear overview of the sector’s boundaries and distinct value chain stages.
The diagram below illustrates the pharmaceutical value chain, highlighting its successive stages – from the sourcing of raw materials to the end-of-life of pharmaceutical products.
The value chain mapping aligns with TNFD’s Additional Guidance by sector, which stems from its Guidance on the identification and assessment of nature-related issues: the LEAP approach (first published in 2023). Working group members refine it through their input.
Illustrative example of the agri-food value chain

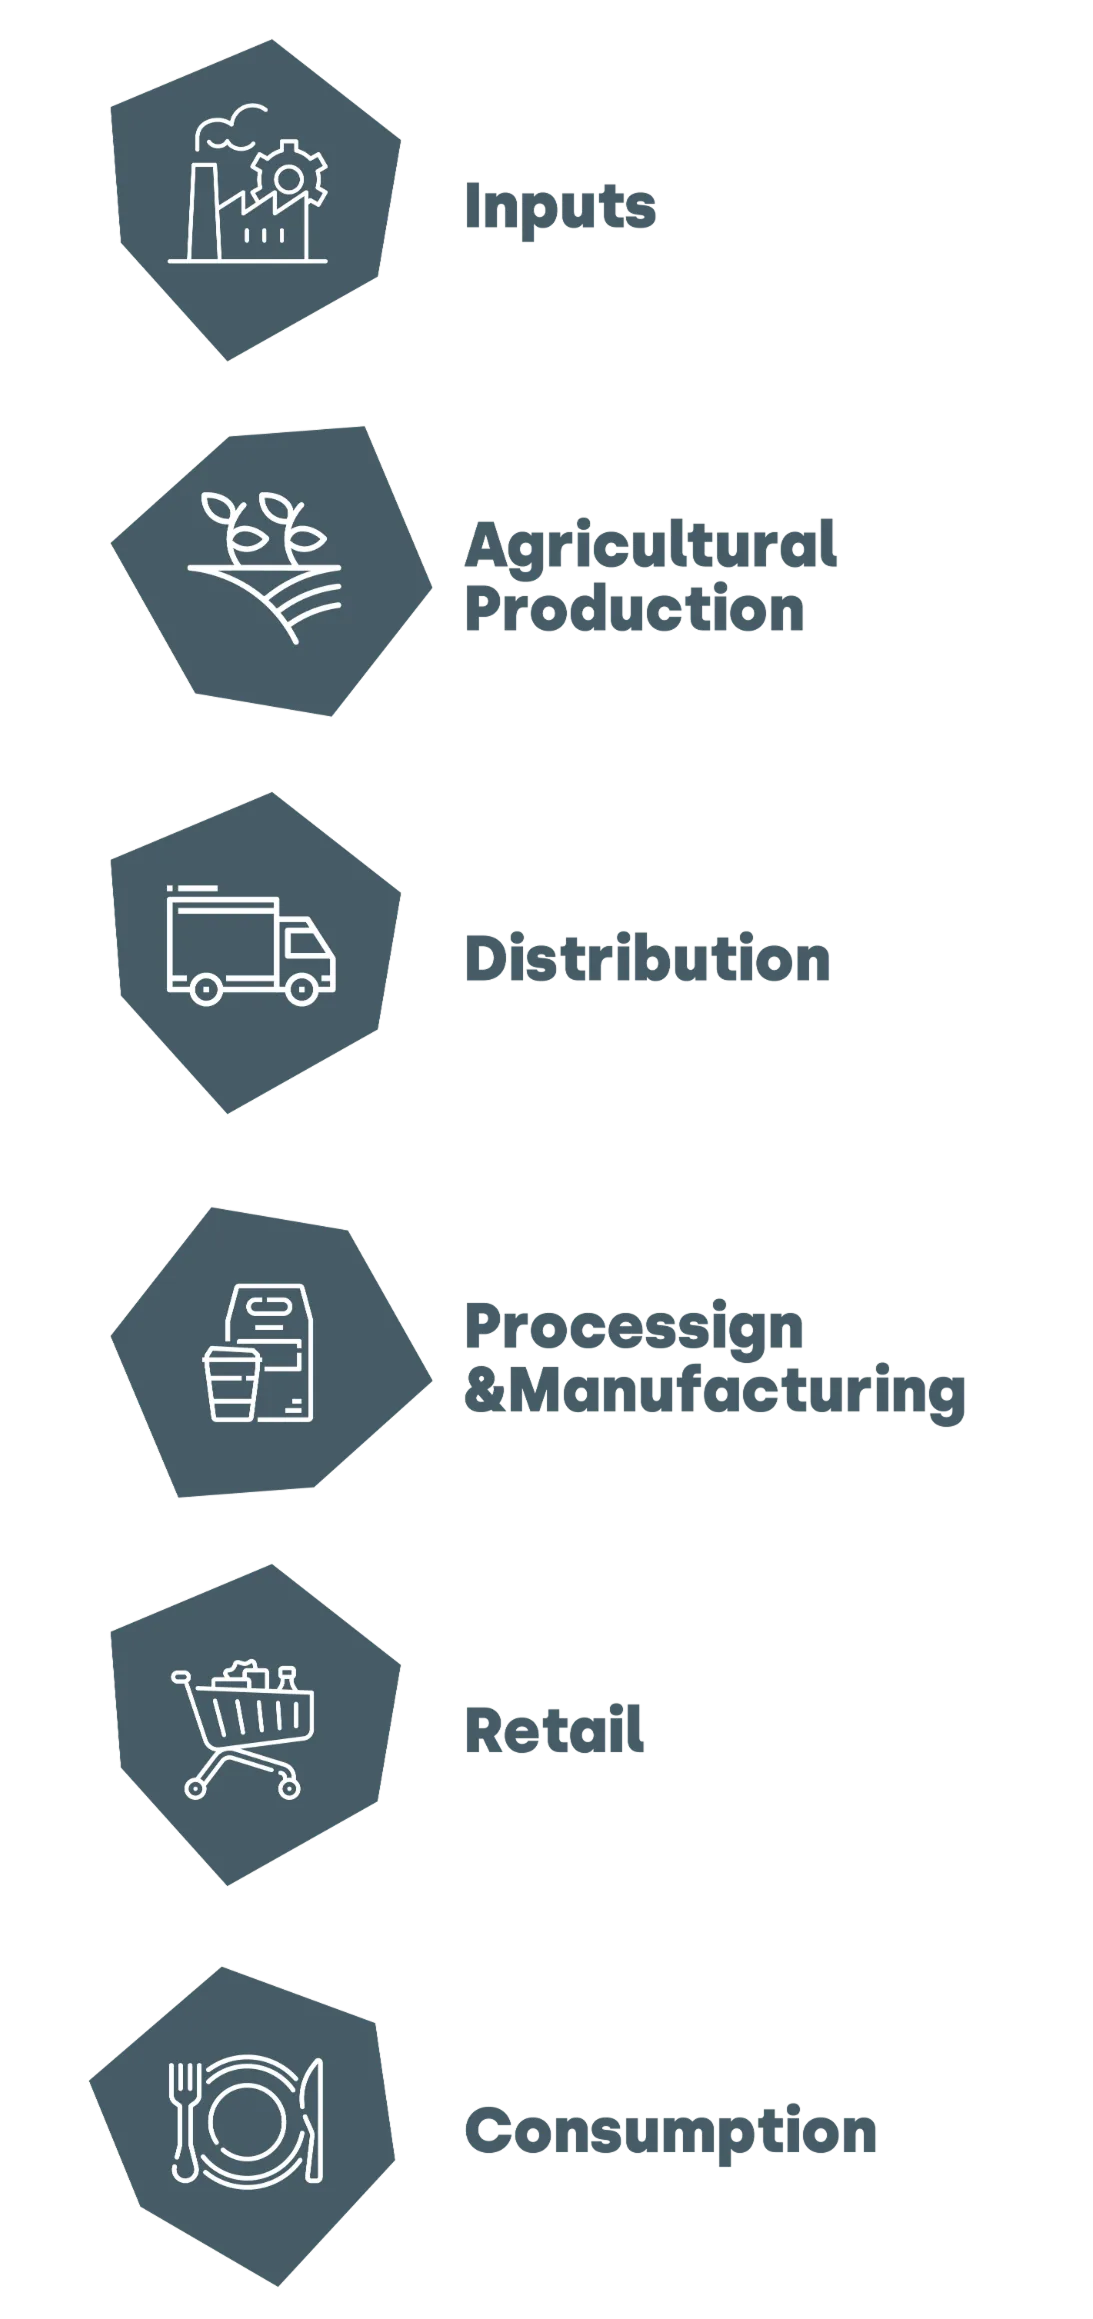
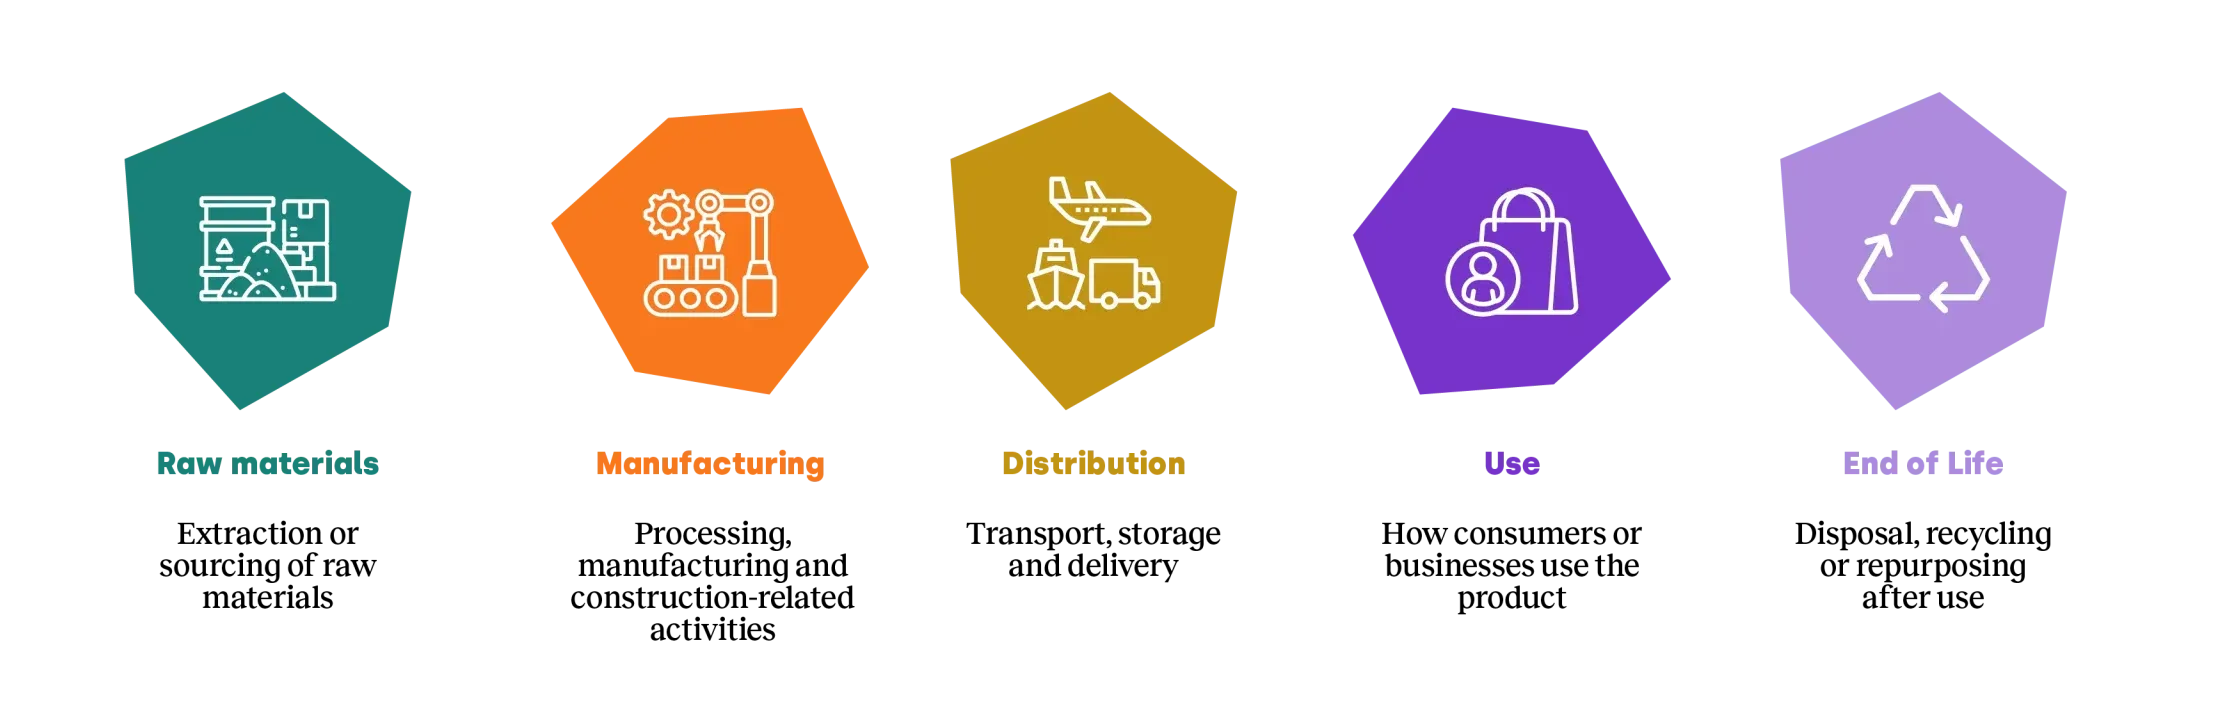
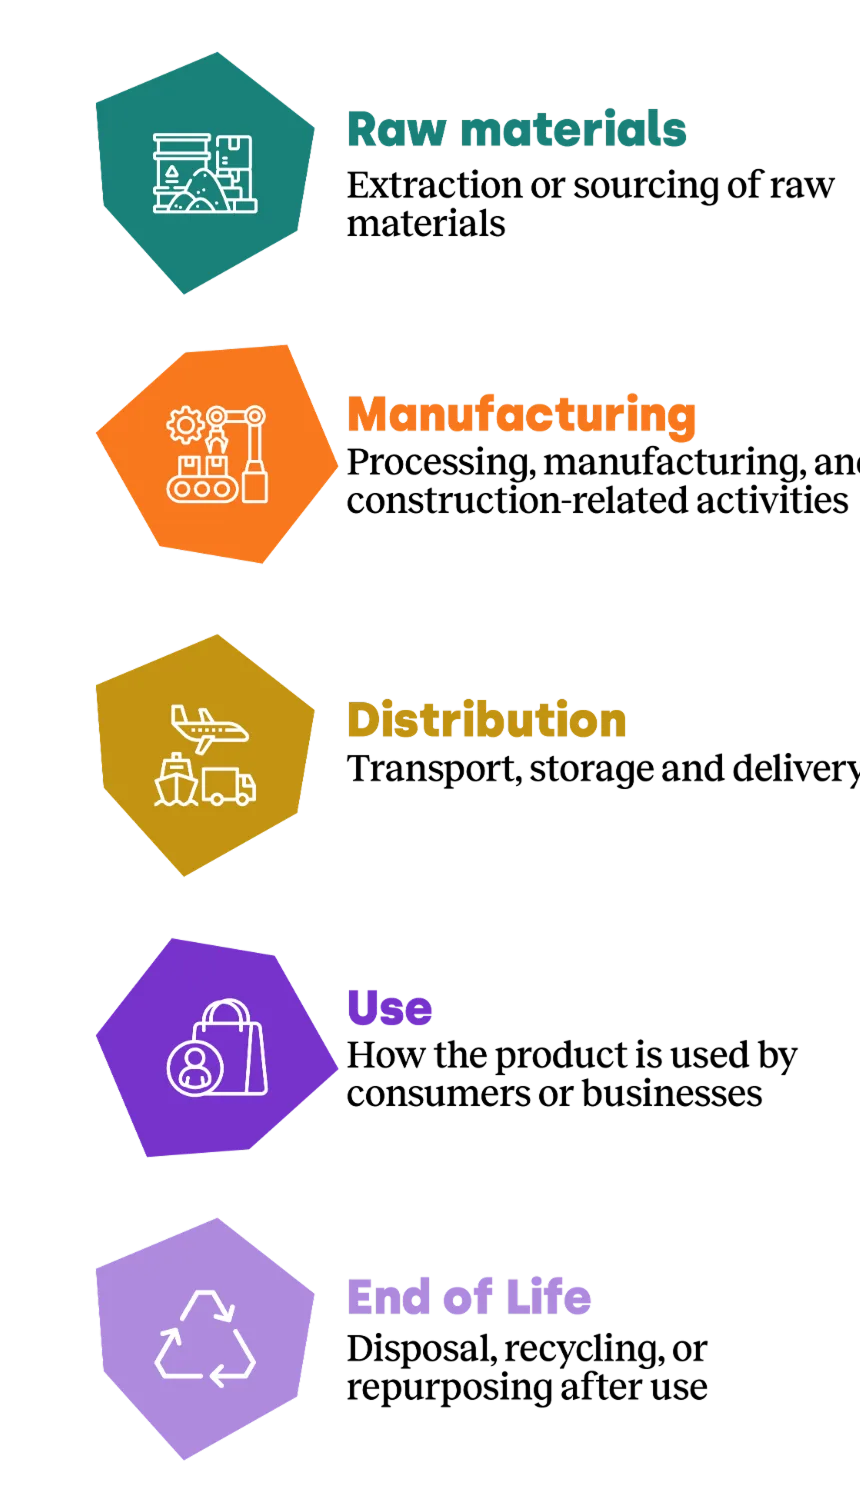
To ensure consistency across the sectors, we’ve aligned the stages of the value chains with the ISO 14044 standard (Environmental management — Life cycle assessment — Requirements and guidelines), which sets requirements for life cycle assessments. The diagram below defines the stages under the ISO 14044 standard.
ISO 14044 standard stage and definitions
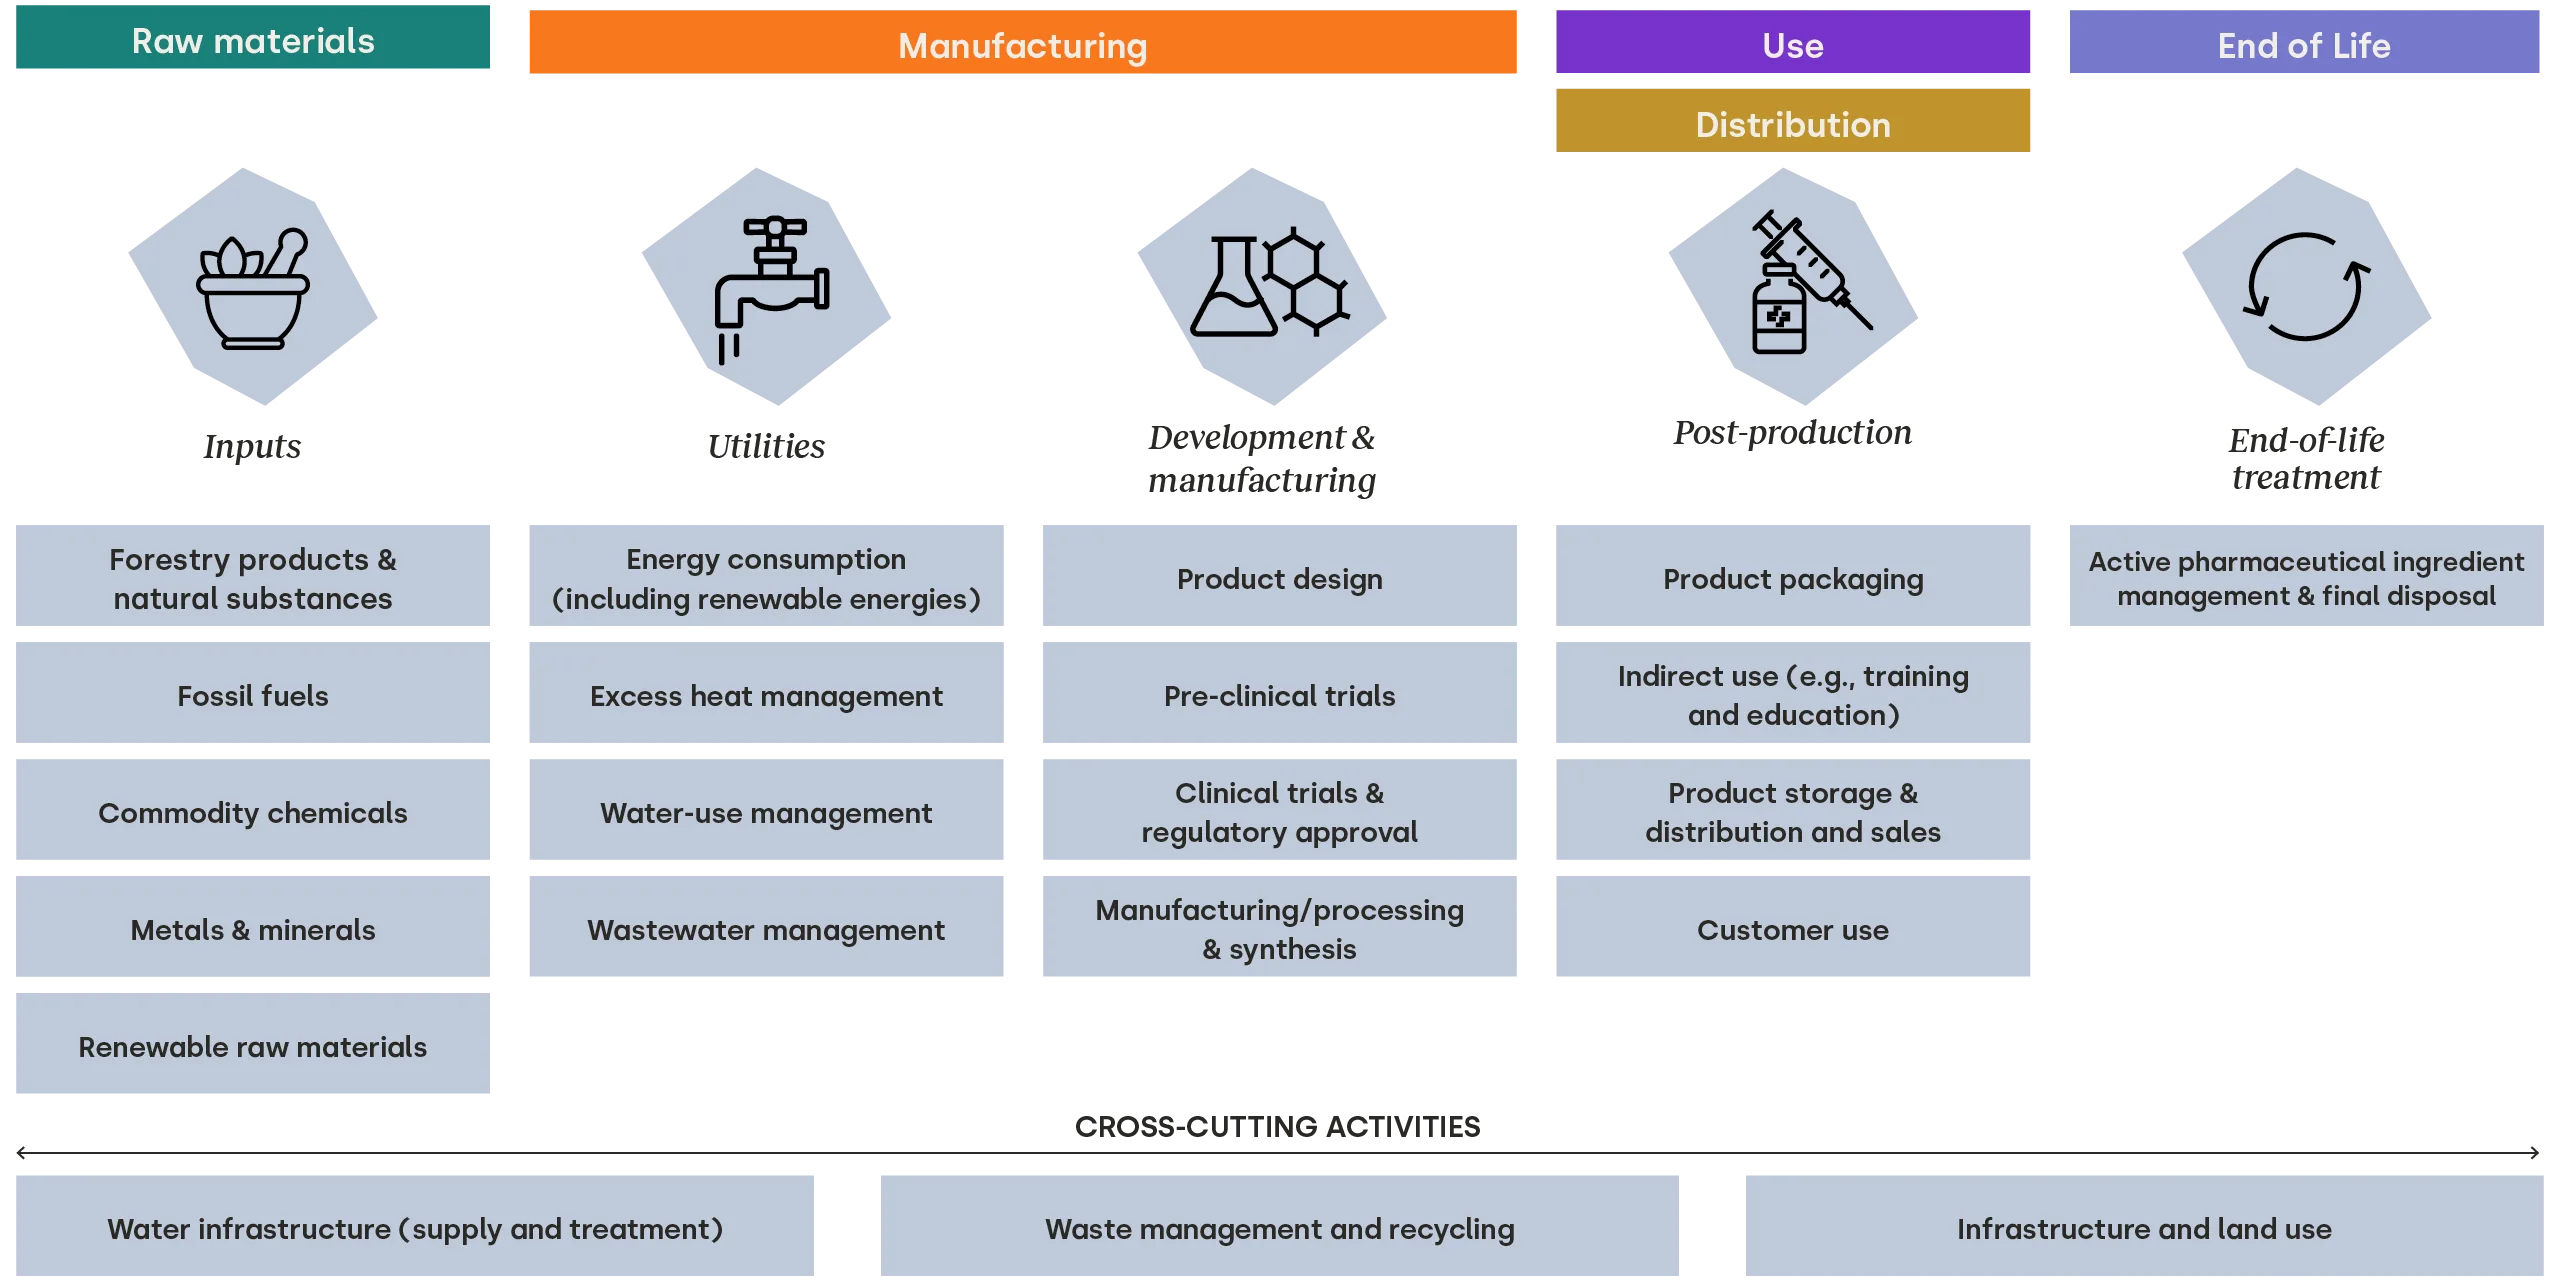
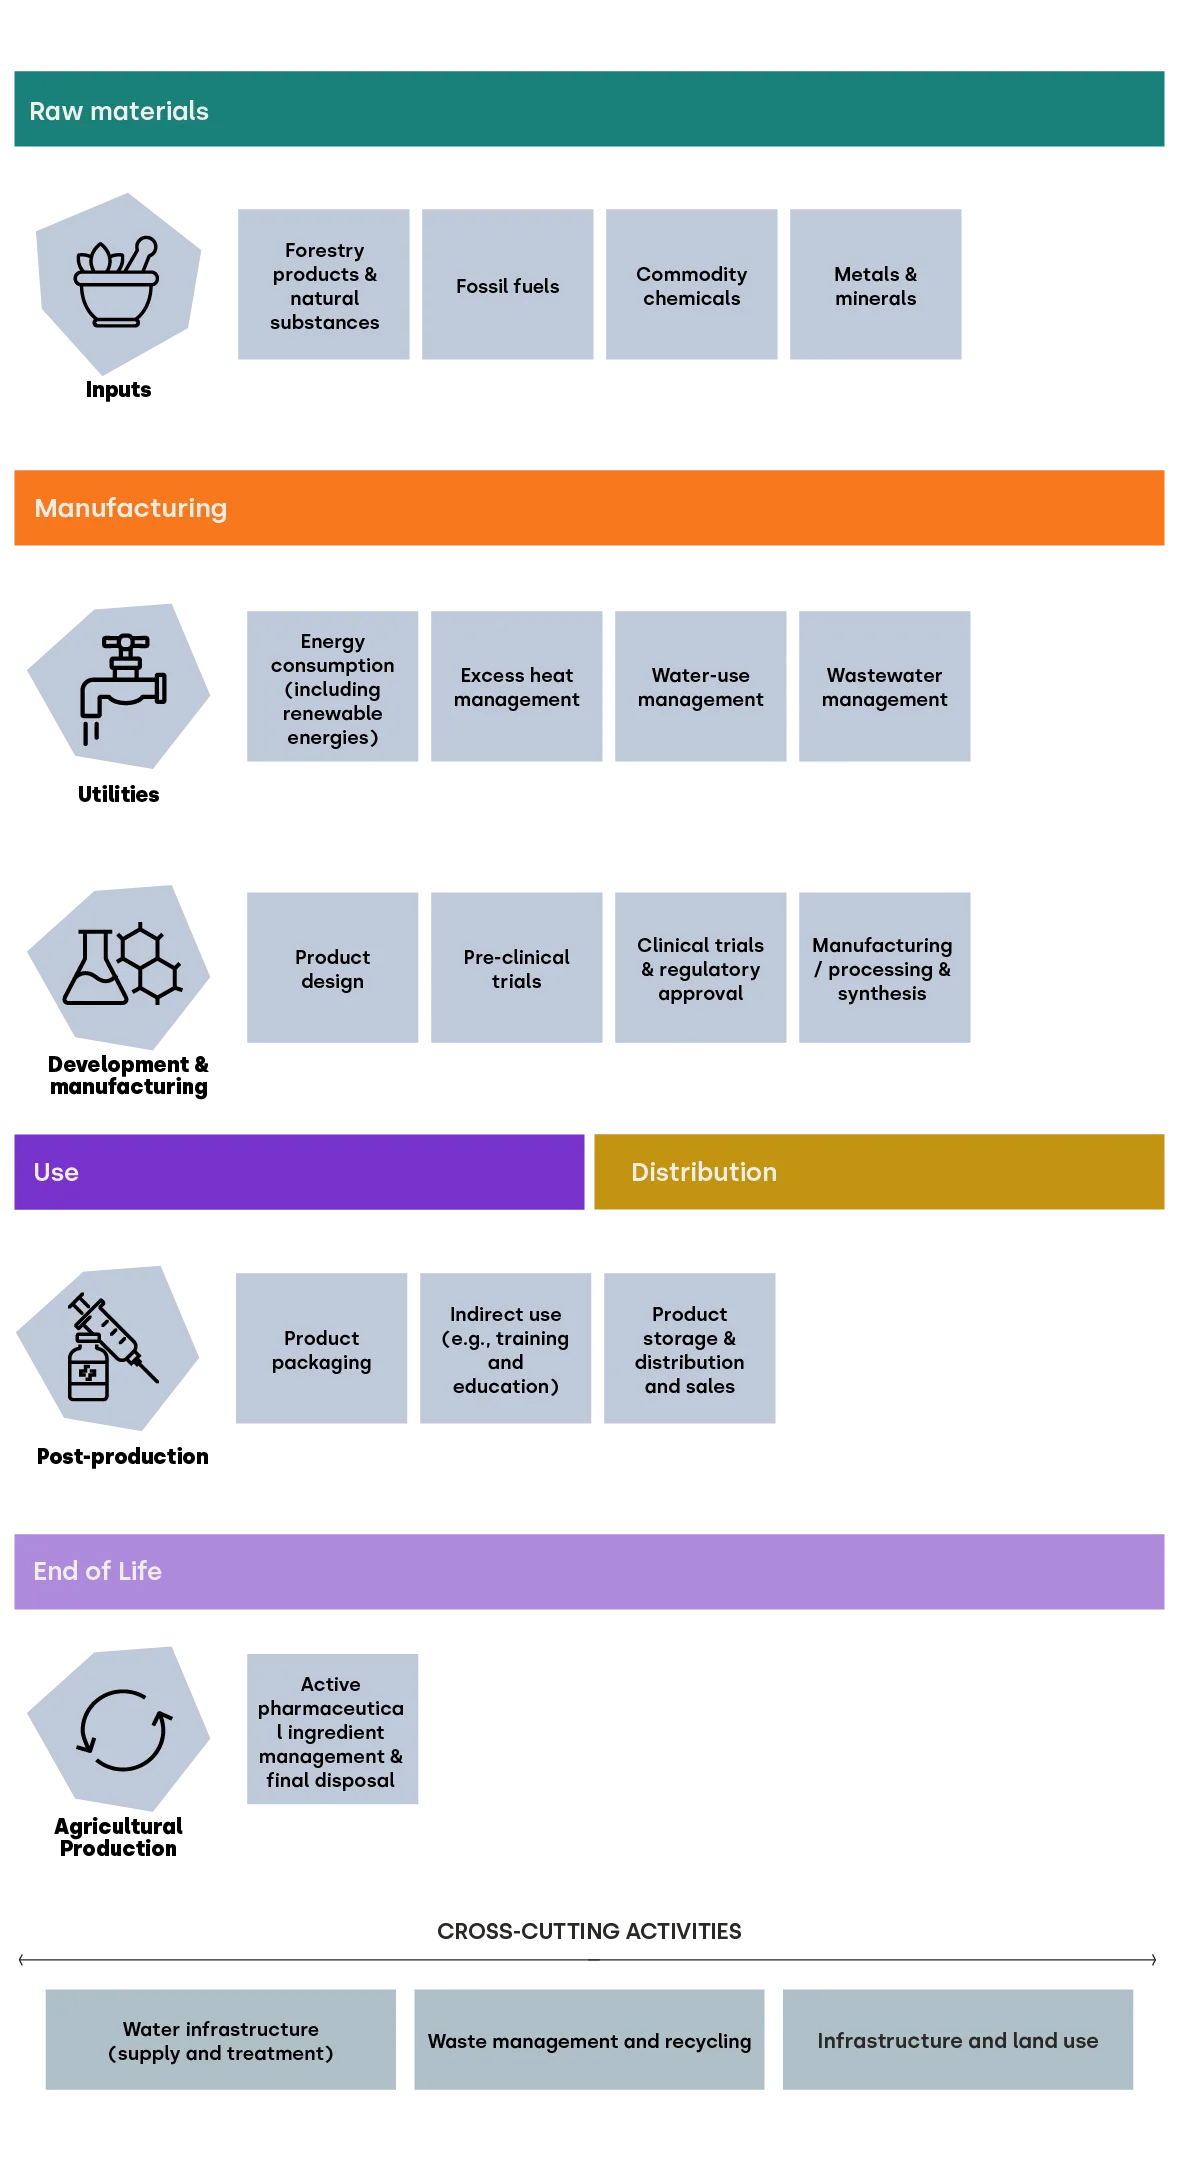
The diagram below illustrates how the ISO 14044 value chain stages overlay the sector-specific value chain stages to allow for comparability and consistency across all sector roadmaps.
Pharmaceutical value chain mapped against the ISO 14044 standard
Defining material DIROs
A company-level materiality assessment on nature should start with an understanding of the typical impacts and dependencies associated with the sector in which it operates.
Each sector roadmap provides an overview of sector-level dependencies, impacts, risks and opportunities (DIROs) across both direct operations and the wider value chain.
The DIROs capture how businesses in that sector interact with nature – relying on and impacting ecosystem services – and how these translate into risks and opportunities for the business.
The materiality assessment provides a company with greater visibility into its relationship with nature, enabling it to identify and manage risks, uncover new business opportunities, and respond effectively to evolving investor and regulatory expectations – ultimately helping to future-proof the business.
Nature-related dependencies and impacts
Business activities rely on ecosystem services such as water, soil fertility, pollination and climate regulation – the dependencies. These services underpin operational continuity and influence investor confidence in a company’s long-term value. At the same time, businesses affect the availability and quality of ecosystems through activities such as land use, emissions, resource extraction and waste generation. These impacts positively or negatively affect the availability and quality of these ecosystem services.For example, intensive agricultural practices degrade soil health and reduce its ability to retain nutrients and water. This degradation diminishes the ecosystem service of soil fertility – an essential dependency for crop production. As soil quality declines, farmers face lower yields and greater reliance on costly chemical inputs, increasing their vulnerability to input price fluctuations and climate-related stresses.
From dependencies and impacts to risks and opportunities
An increasing number of businesses are making the connection between the health of ecosystems and their bottom line. Risks and opportunities originate from business impacts on nature and the associated impacts on stakeholders, as well as corporate and societal dependencies on ecosystem services.
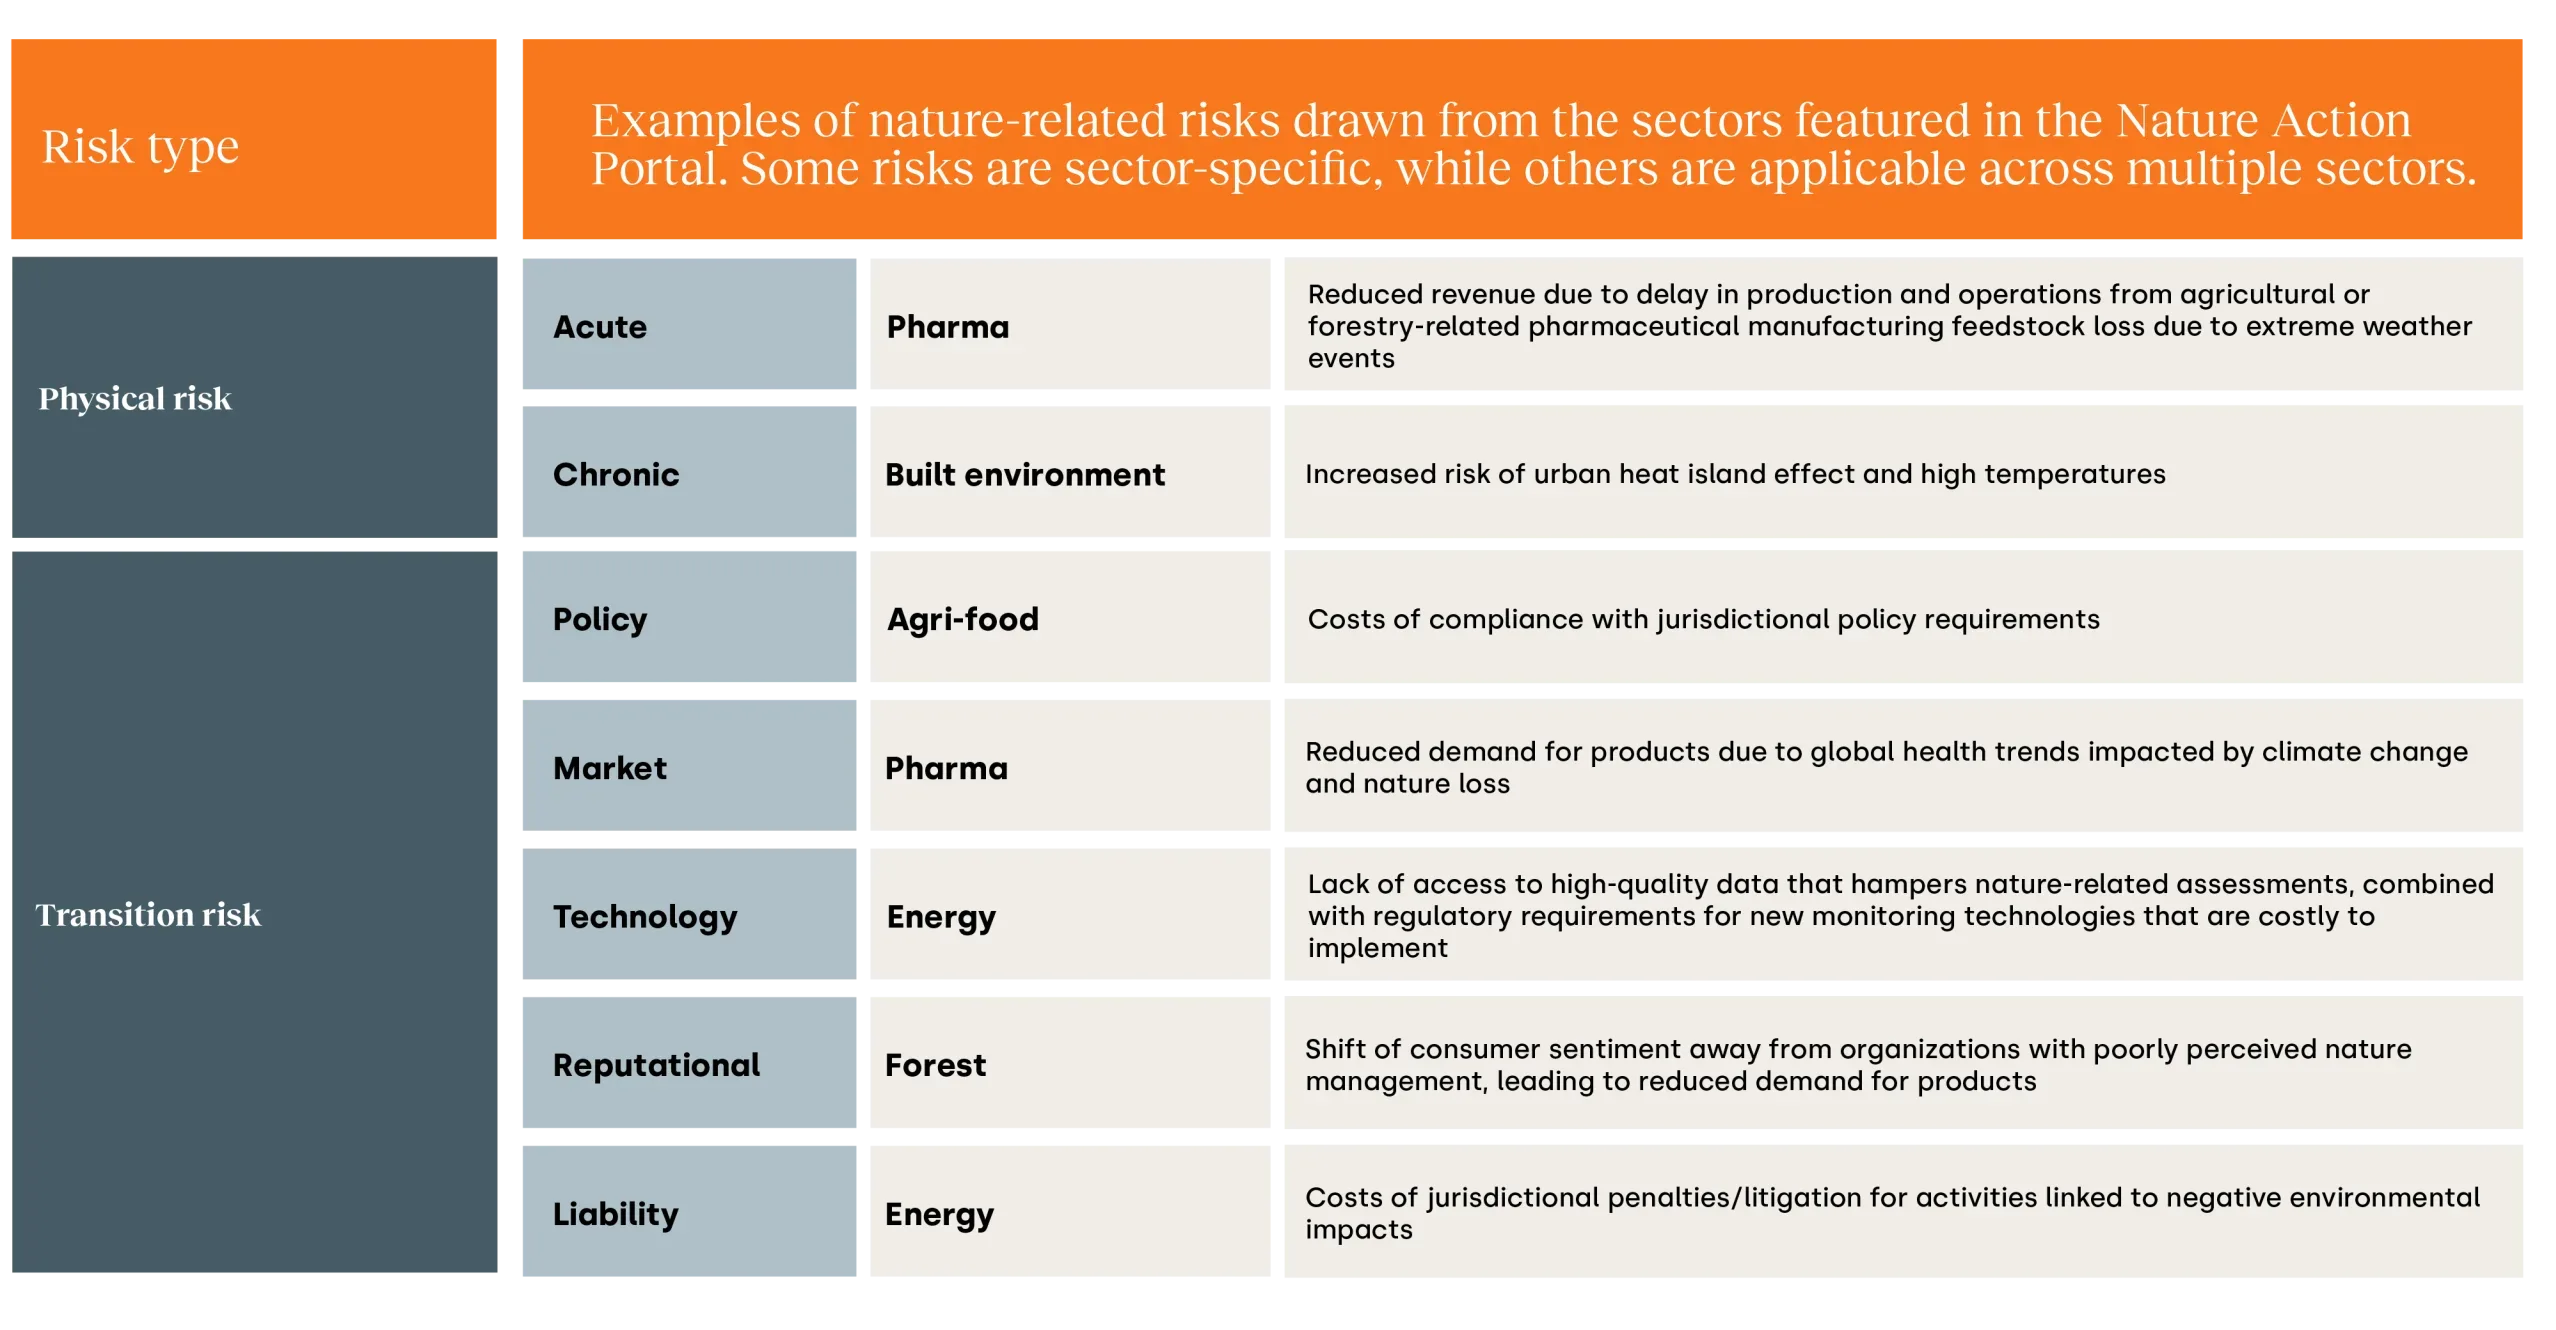
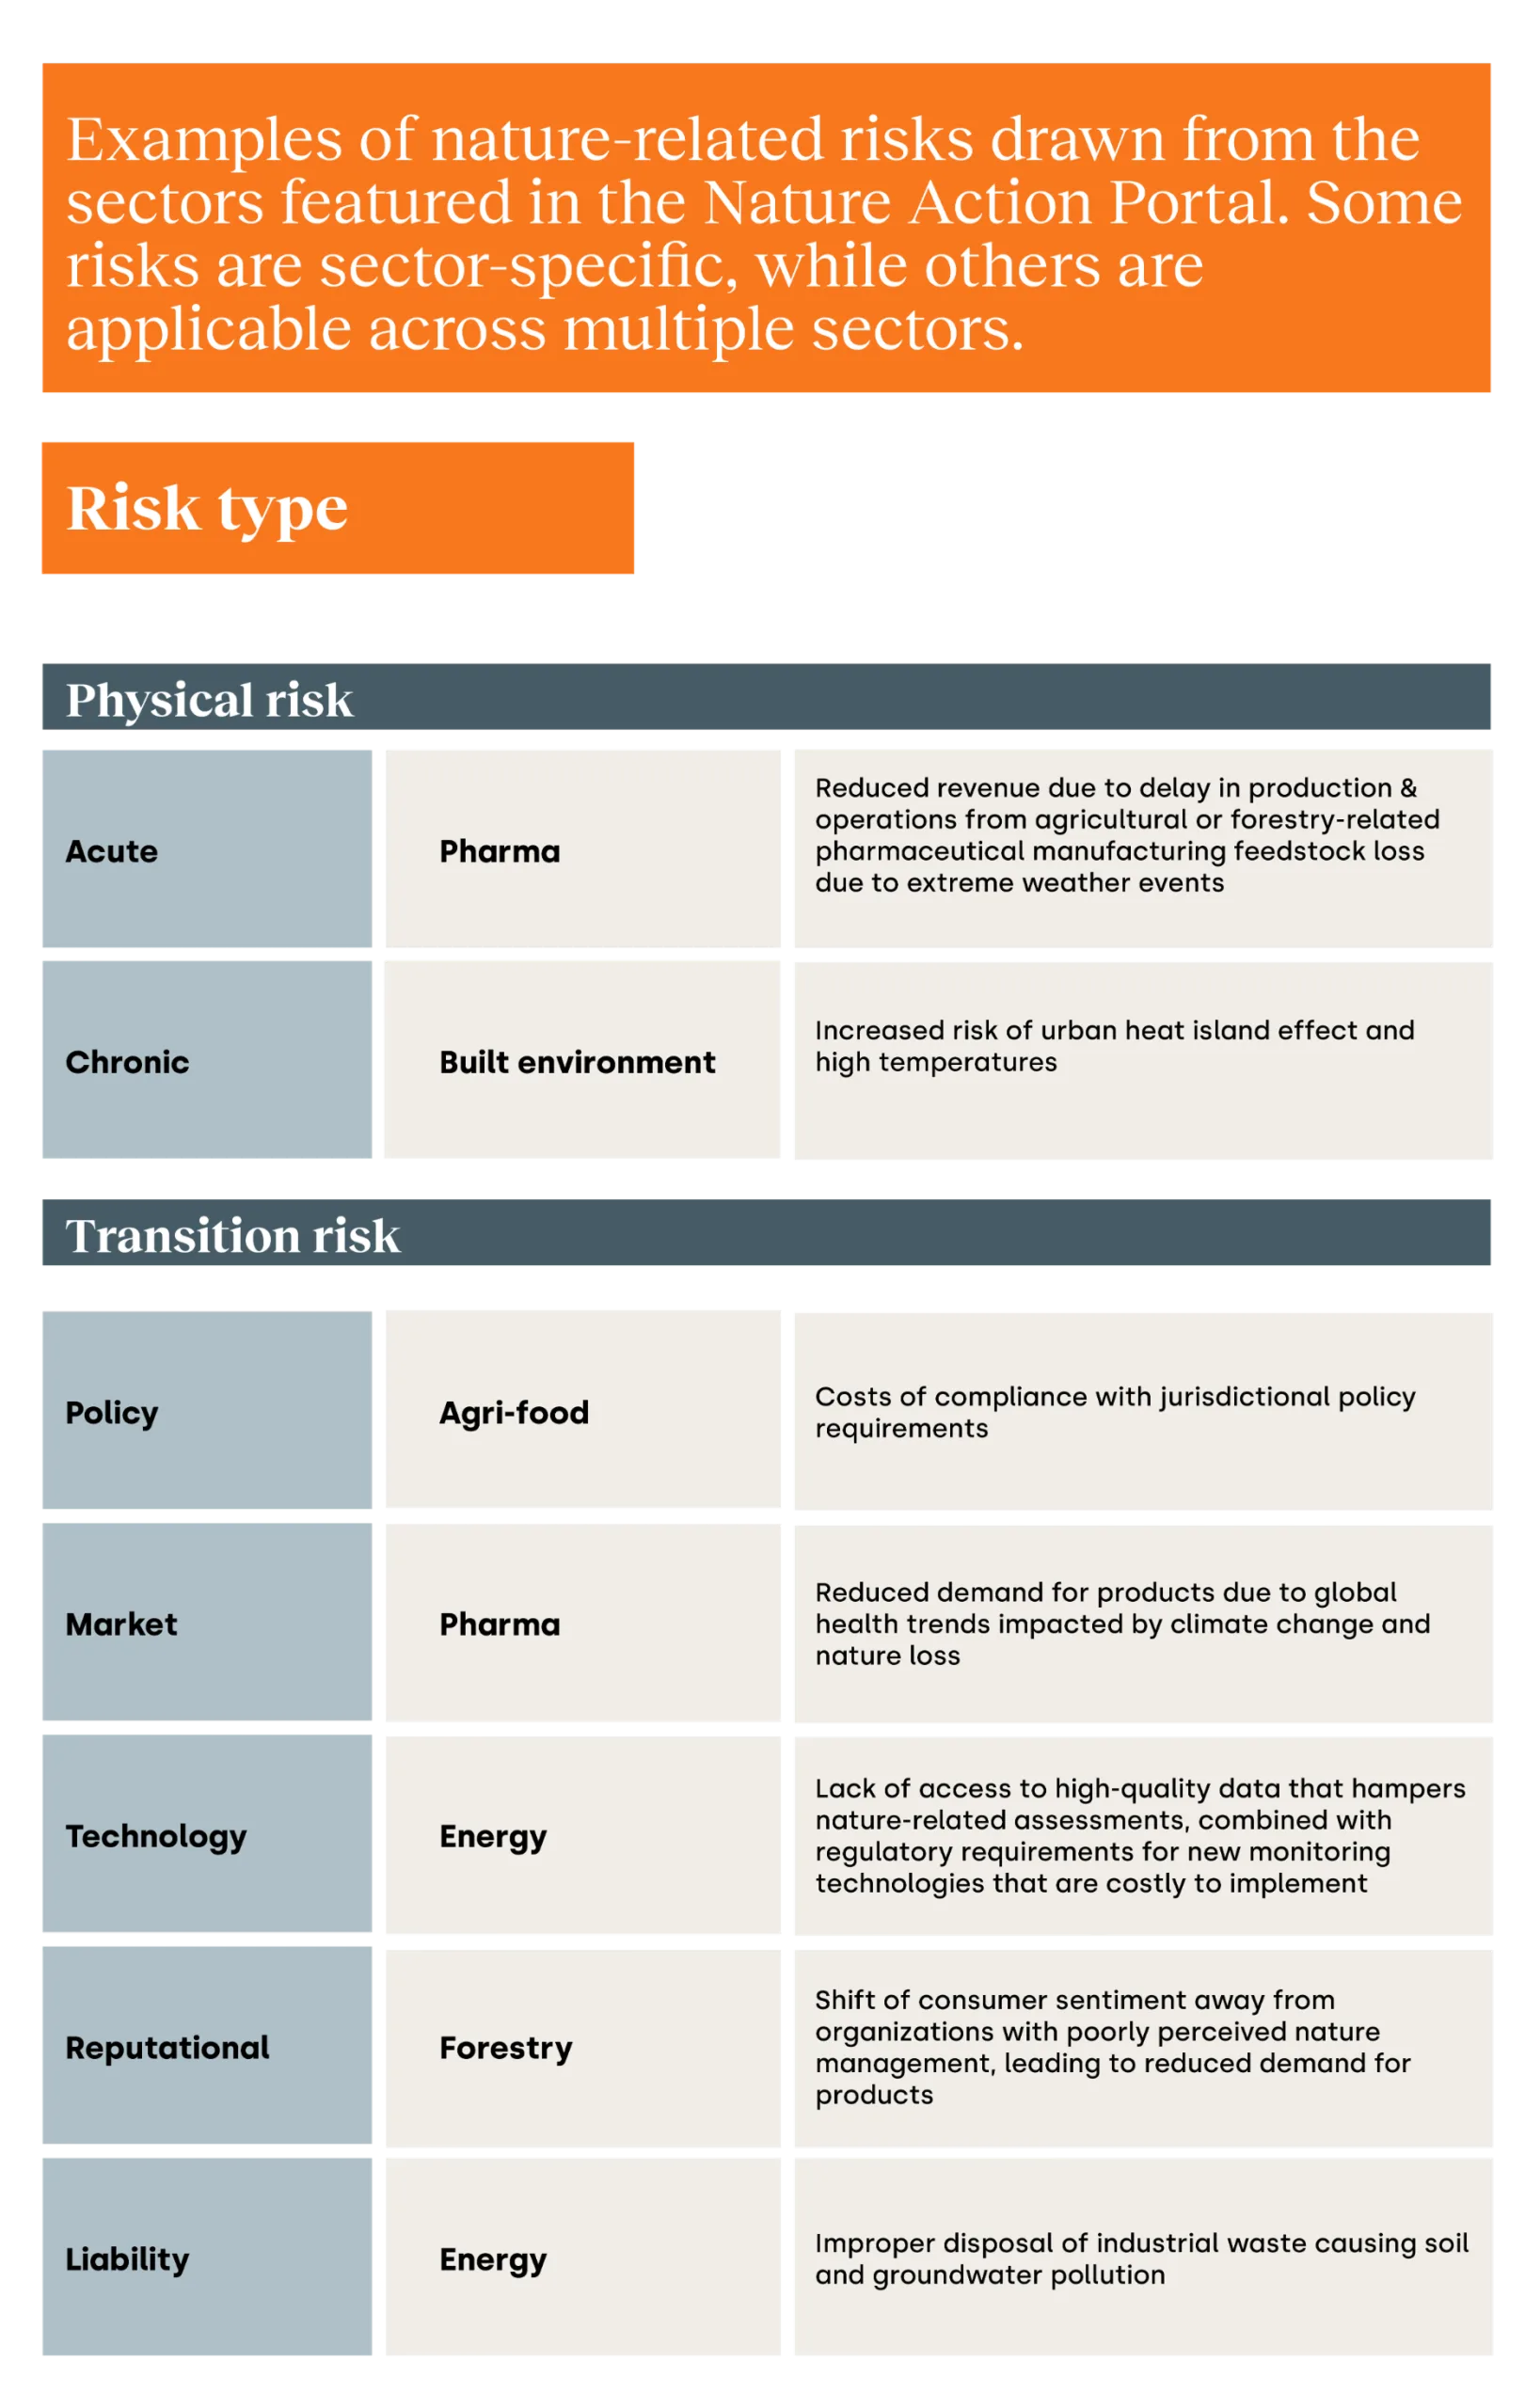
Per the TNFD, two key dimensions define risks: physical and transition.
- Physical risks include acute risks, such as sudden extreme weather events disrupting operations, and chronic risks, such as long-term ecosystem degradation reducing resource availability.
- Transition risks encompass policy risks from evolving regulations; market risks driven by shifting consumer preferences and supply chain dynamics; technology risks linked to innovation gaps or obsolescence; reputational risks from stakeholder scrutiny and brand perception; and liability risks associated with legal exposure for environmental harm.
The ACT-D framework provides a clear basis for assessing and mitigating nature-related risks that could affect business resilience and strategic planning. Nature-related risks in the Portal follow TNFD’s LEAP approach.
Nature-related risks (examples from the different sectors featured in the Nature Action Portal)
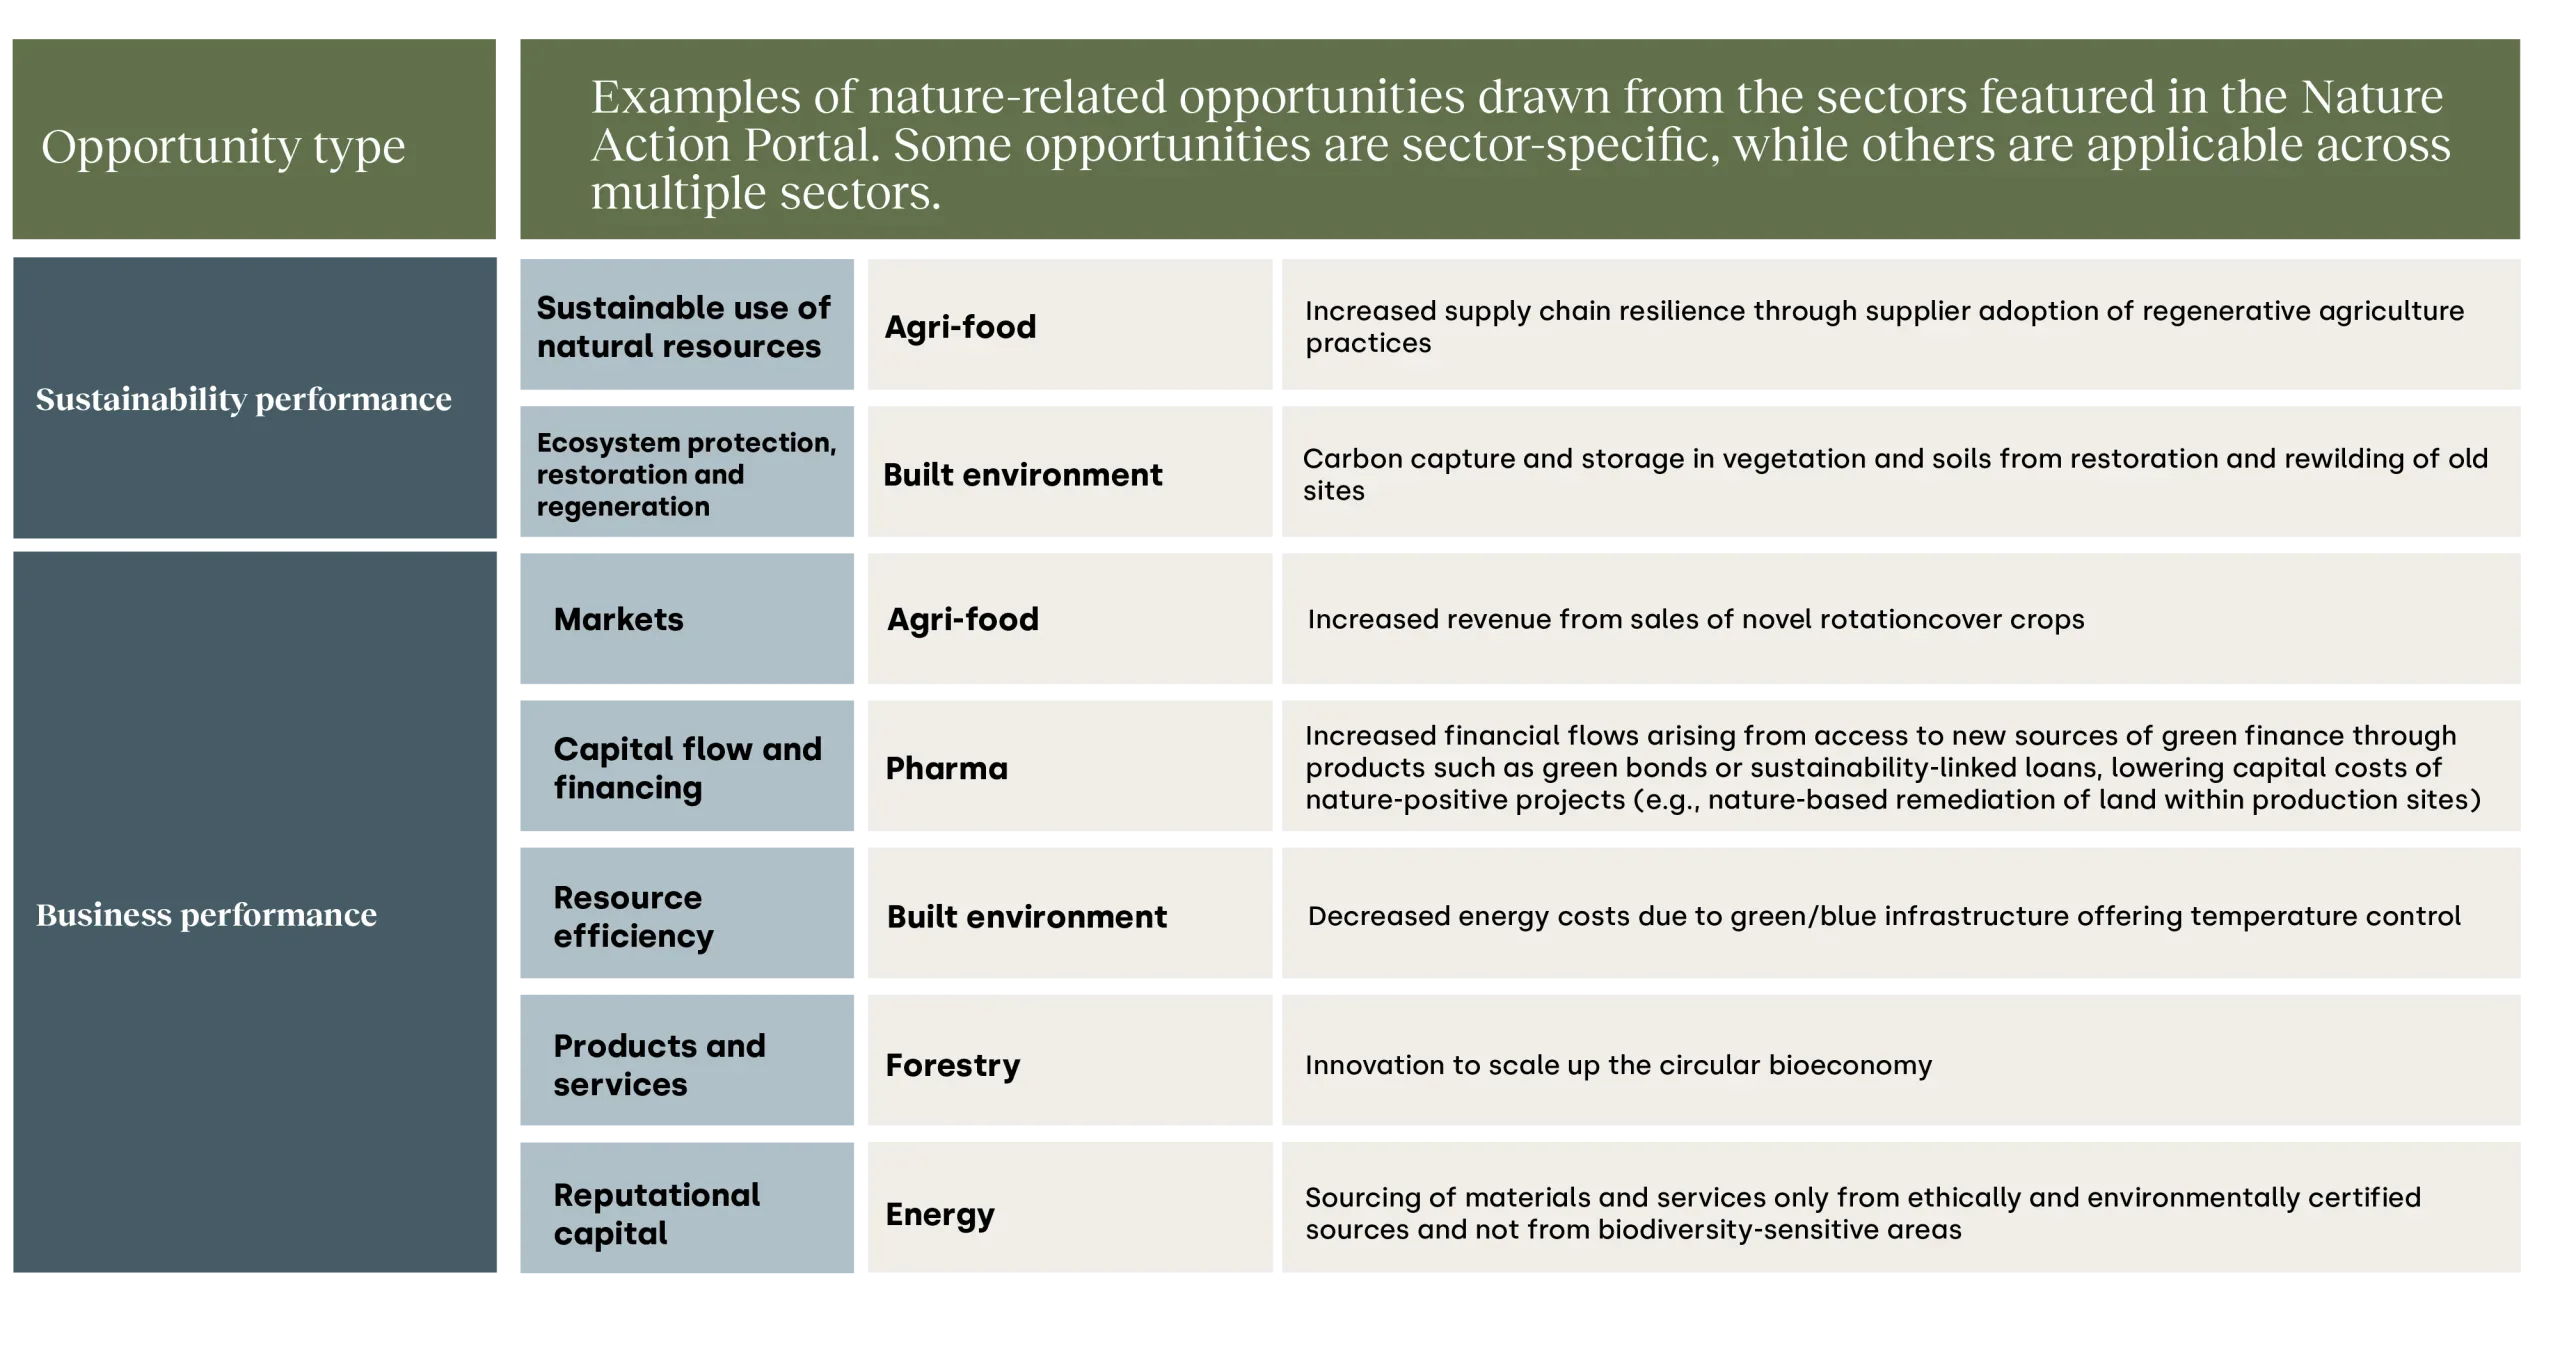
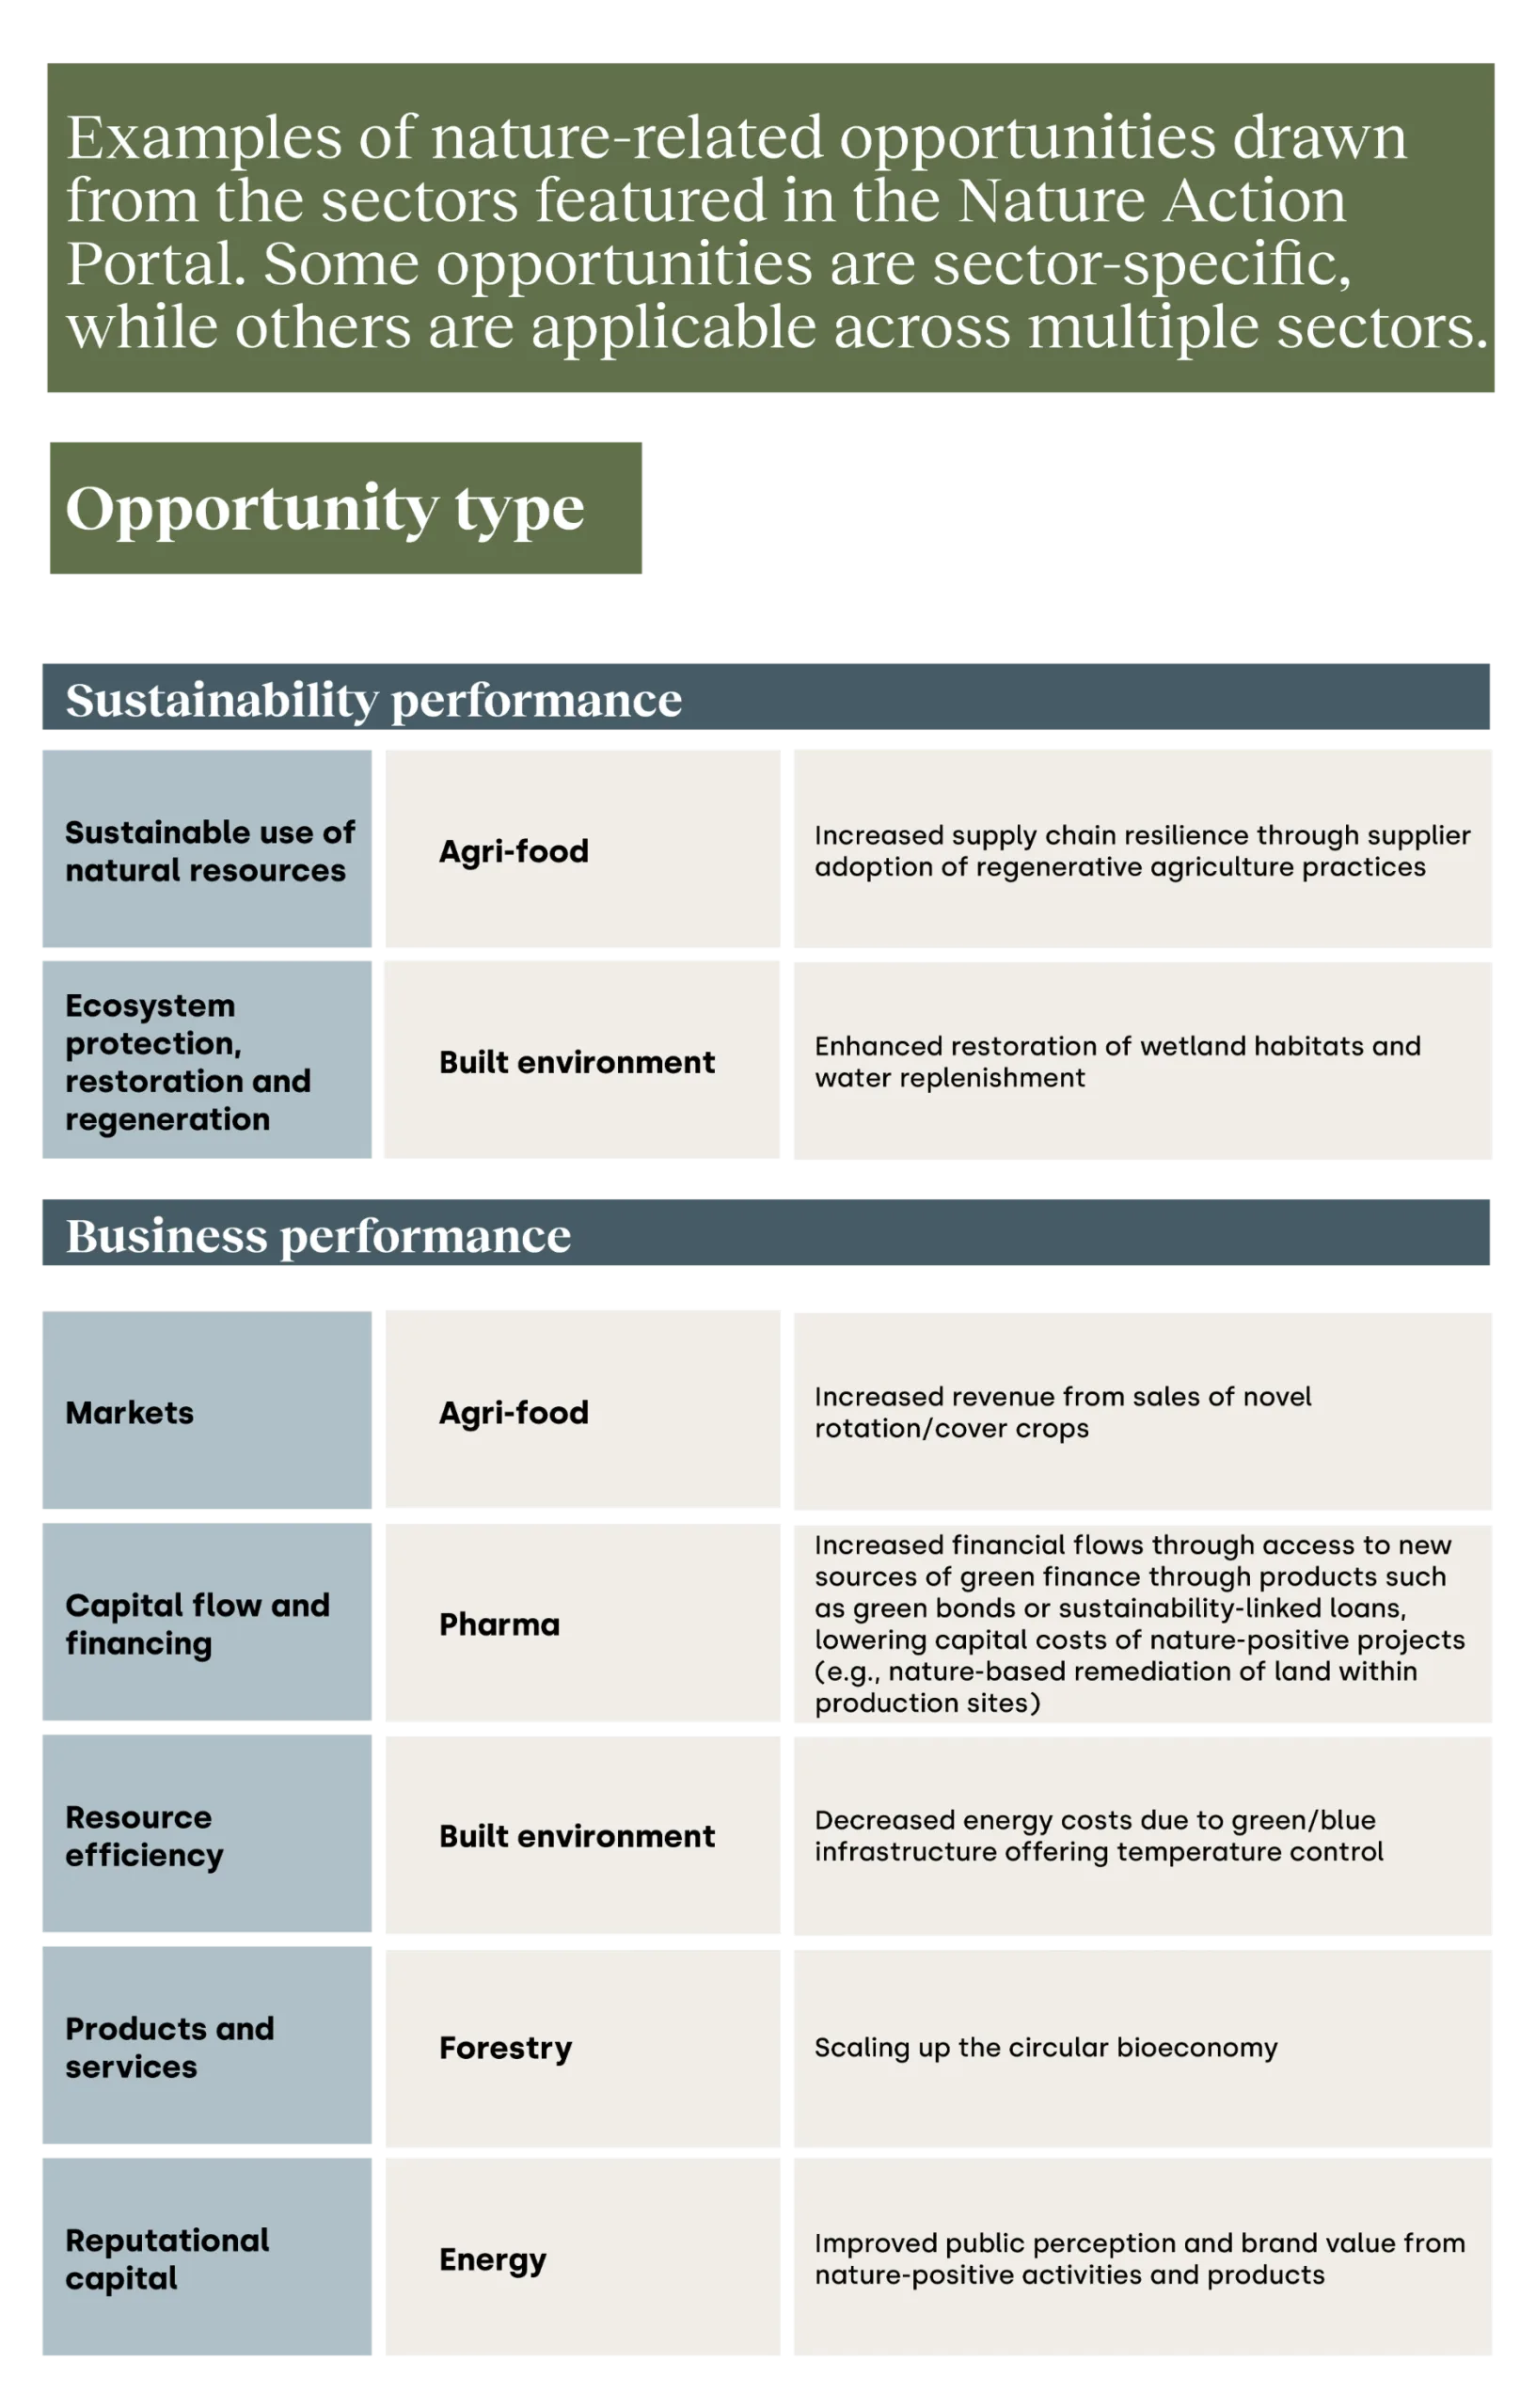
Conversely, a range of nature-related opportunities can contribute to business performance and sustainability performance. From a business perspective, nature-related action can result in opportunities such as expanding markets, improving capital flow and financing, enhancing resource efficiency, innovating products and services, and strengthening reputational capital.
Taking action on key nature-related impacts also supports sustainability performance, including sustainable use of natural resources and ecosystem protection, restoration and regeneration.
Together, these categories and subcategories provide a structured lens for identifying and prioritizing actions that deliver both economic value and positive environmental impact.
Nature-related opportunities (examples from the different sectors featured in the Nature Action Portal)
Assessing sector-level DIROs
A sector-level overview of dependencies and impacts provides a useful foundation for a company-level materiality screening. It highlights the typical DIROs relevant to companies operating in the same sector.
A company-level materiality screening should follow it – as recommended by the Natural Capital Protocol, SBTN and TNFD frameworks – to evaluate how the potential sector-level DIROs apply to the specific context of an individual company.
The mapping of the sector-level chain (described previously) provides the foundation and scope to identify material DIROs at the sector level, ensuring businesses consider all potential dependencies (reliance on ecosystem services) and impacts (effects on ecosystems). The ratings of the sector-level materiality assessment represent an average based on ENCORE (Exploring Natural Capital Opportunities, Risks and Exposure) data, using the most recent version available at the time of the analysis.
We mapped the International Standard Industrial Classification of All Economic Activities (ISIC)-coded business activities from ENCORE against the value chain stages. Then we mapped the sector-level impacts and dependencies against TNFD’s categories of impact drivers or “pressures” tied to the five drivers of nature loss, as defined by the Intergovernmental Science-Policy Platform on Biodiversity and Ecosystem Services (IPBES).
Working group members calibrated the results at the sector-level. The diagram below offers an overview of the potential impacts on nature that can occur along the pharmaceutical sector value chain.
Impacts associated with phases of the pharmaceutical sector value chain
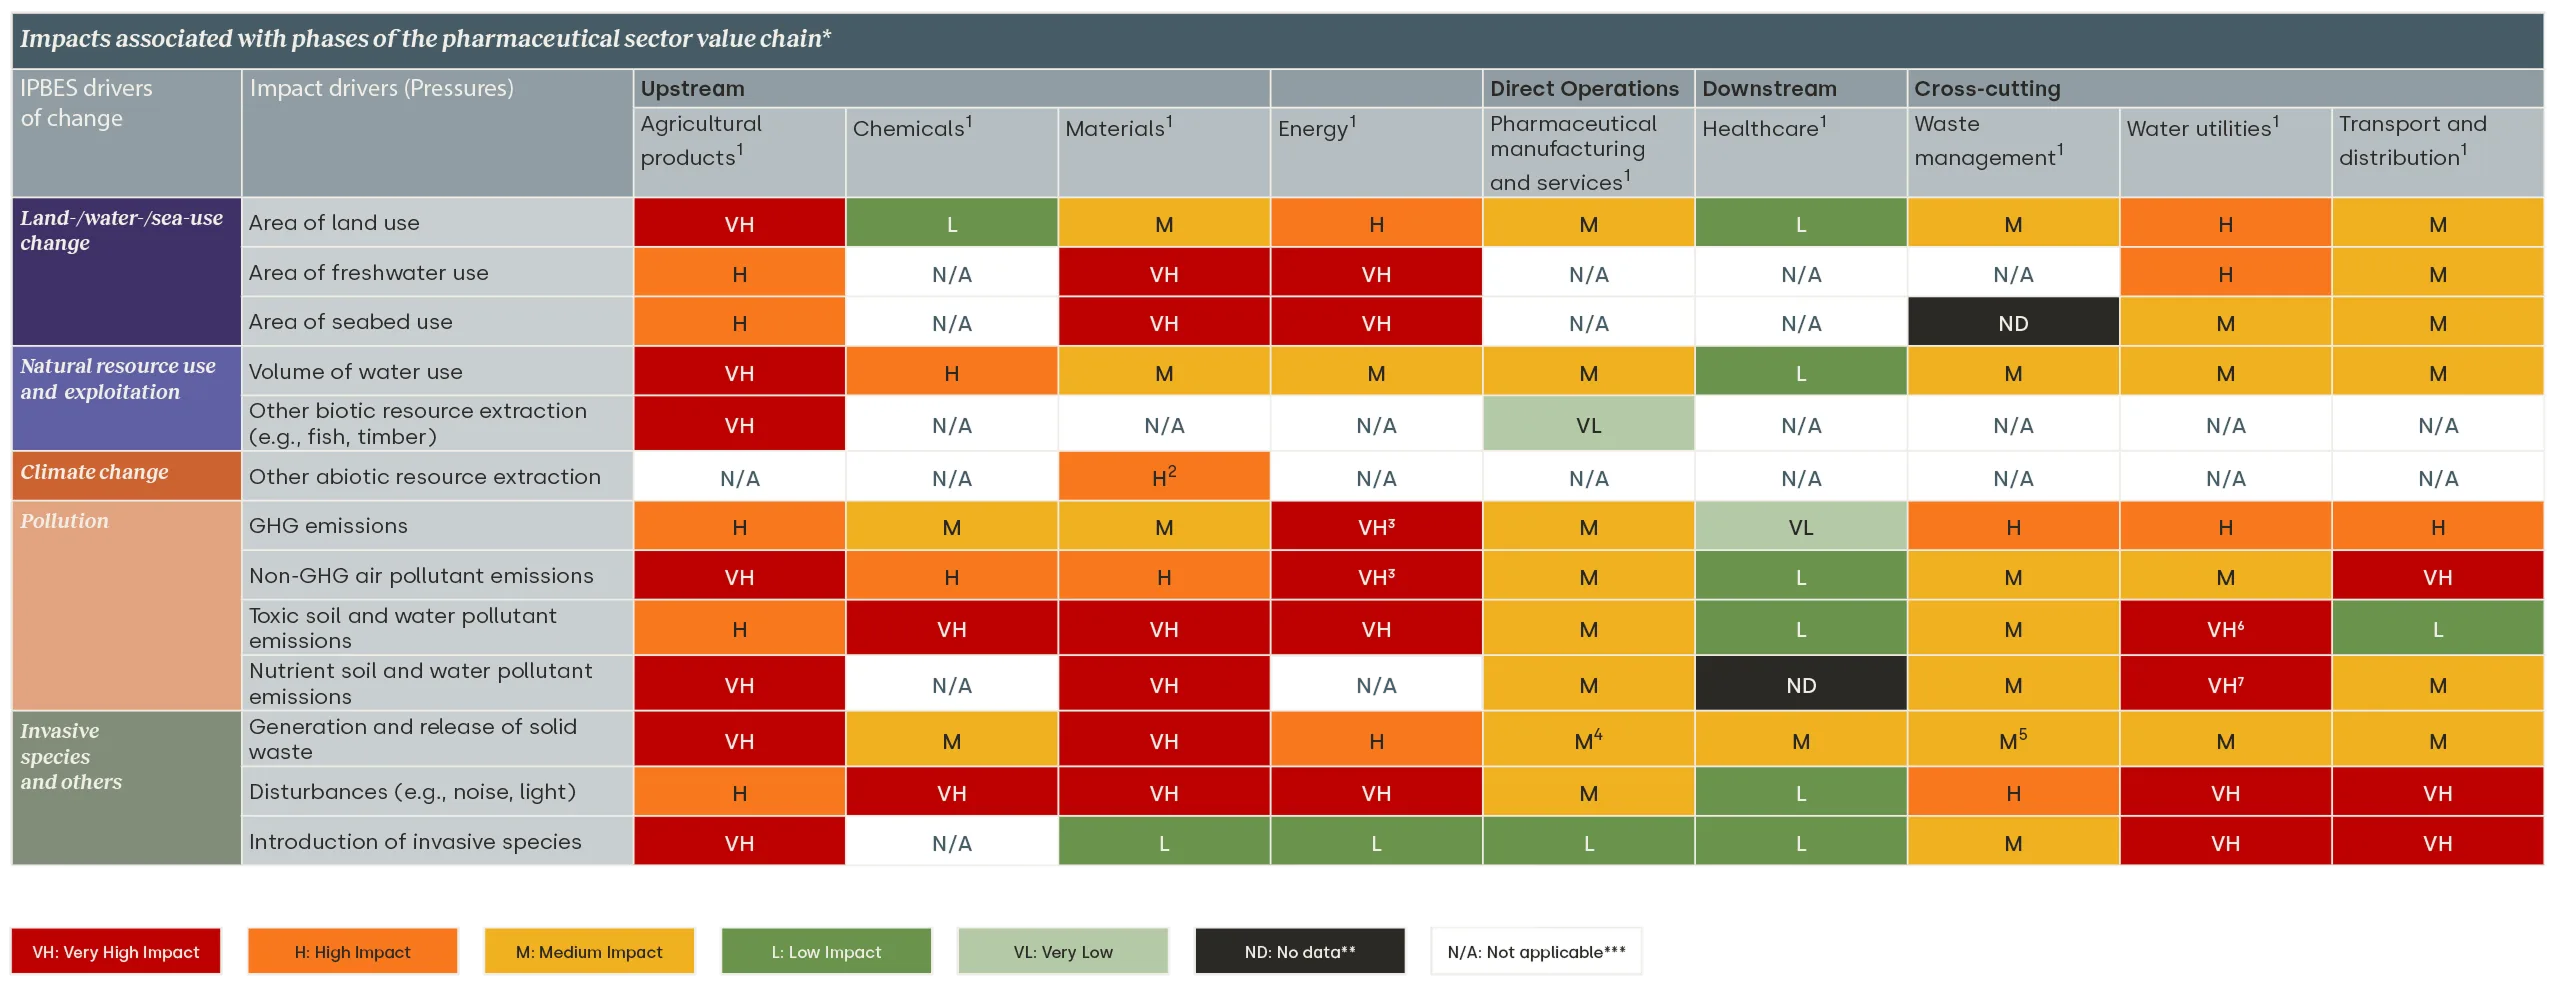
The materiality ratings in this diagram are based on the 2024 version of the ENCORE database.
Where materiality ratings are not provided, the impact driver at a certain spot in the value chain is categorized as either:
- No data: which refers to areas for which insufficient data was available to ENCORE to calculate a materiality rating; or
- Not applicable: which refers to areas where ENCORE has determined an ecosystem service does not apply to a given business activity.
STEP 2: Plan actions
The ACT-D Framework and STEP 2: Plan actions

Developing actions to halt and reverse nature loss
After completing an initial materiality screening, companies can start planning for the actions that will allow businesses to address the most material impacts and dependencies and contribute to halting and reversing nature loss.
To do so, it is useful to consider the full spectrum of the science-based actions available to a company and assess their relevance in its specific business and geographic context. To support this process, the sector roadmaps offer a comprehensive overview of actions that a company operating in each sector can implement across operations and supply chains.
The actions proposed align with SBTN’s Action Framework (AR3T), which introduces a distinction between the actions that contribute to halting and reversing nature loss (actions to avoid or reduce loss of nature) and those that contribute to reversing loss (restorative and regenerative actions). (See diagram below.)
SBTN’s Action Framework (AR3T)

The diagram below offers a description of each level of the SBTN mitigation hierarchy along with examples of such actions from the roadmaps.
Examples of nature nature-related actions from the Nature Action Portal mapped to the SBTN AR3T framework

While many of these actions will be relatively well-established practices, others offer room for further scale and replication.
Companies should implement these individual actions as part of a cohesive corporate-level strategy and, when relevant, through collaboration across supply chains and sectors, and with multiple stakeholders at the landscape or regional level. They should prioritize actions where they have the greatest leverage and potential for positive impact, regardless of their position in the mitigation hierarchy.
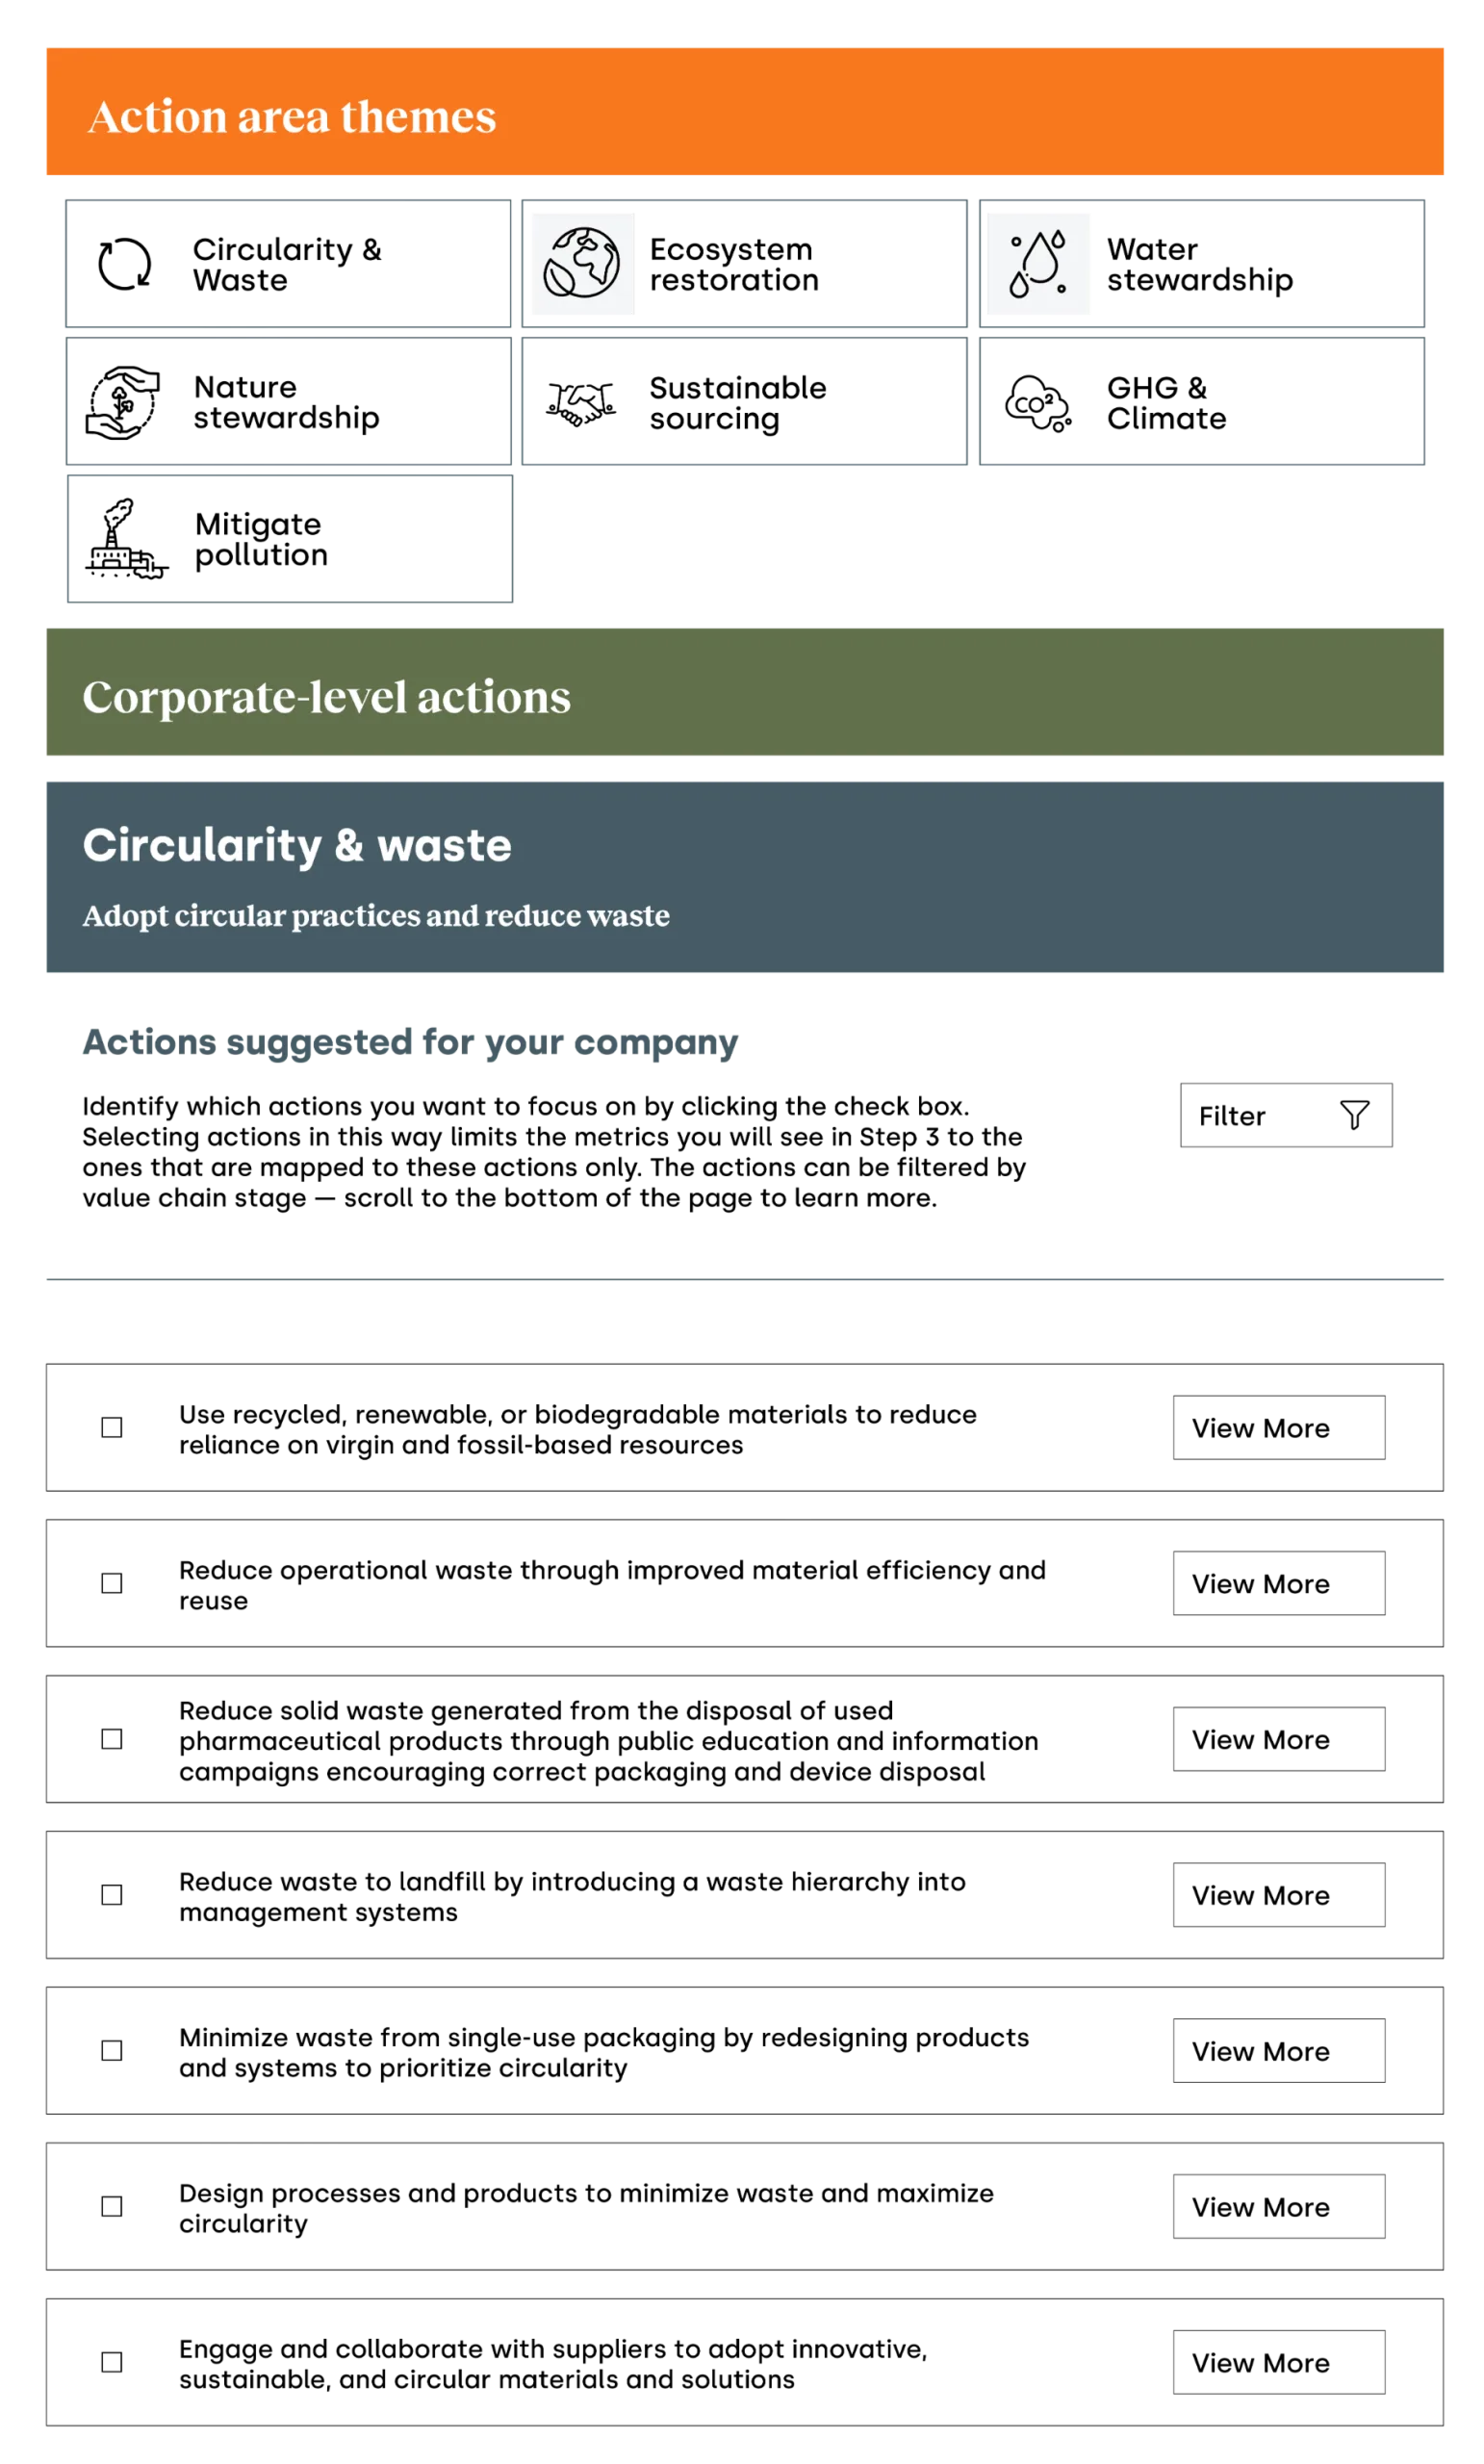
Categorizing actions in the Nature Action Portal
We’ve categorized the actions in the Portal under two elements: action areas by theme (e.g., circularity and waste) and corporate-level actions (e.g., reduce operational waste through improved material efficiency and reuse).
- The action area by theme groups actions according to broad sustainability topics to provide a thematic lens, helping organizations identify where to focus efforts across sectors and supply chains.
- The corporate-level actions are specific, actionable steps that companies can implement internally. The following diagram outlines this distinction.
Action area by theme and corporate-level actions

STEP 3: Choose metrics
The ACT-D Framework and STEP 3: Choose metrics

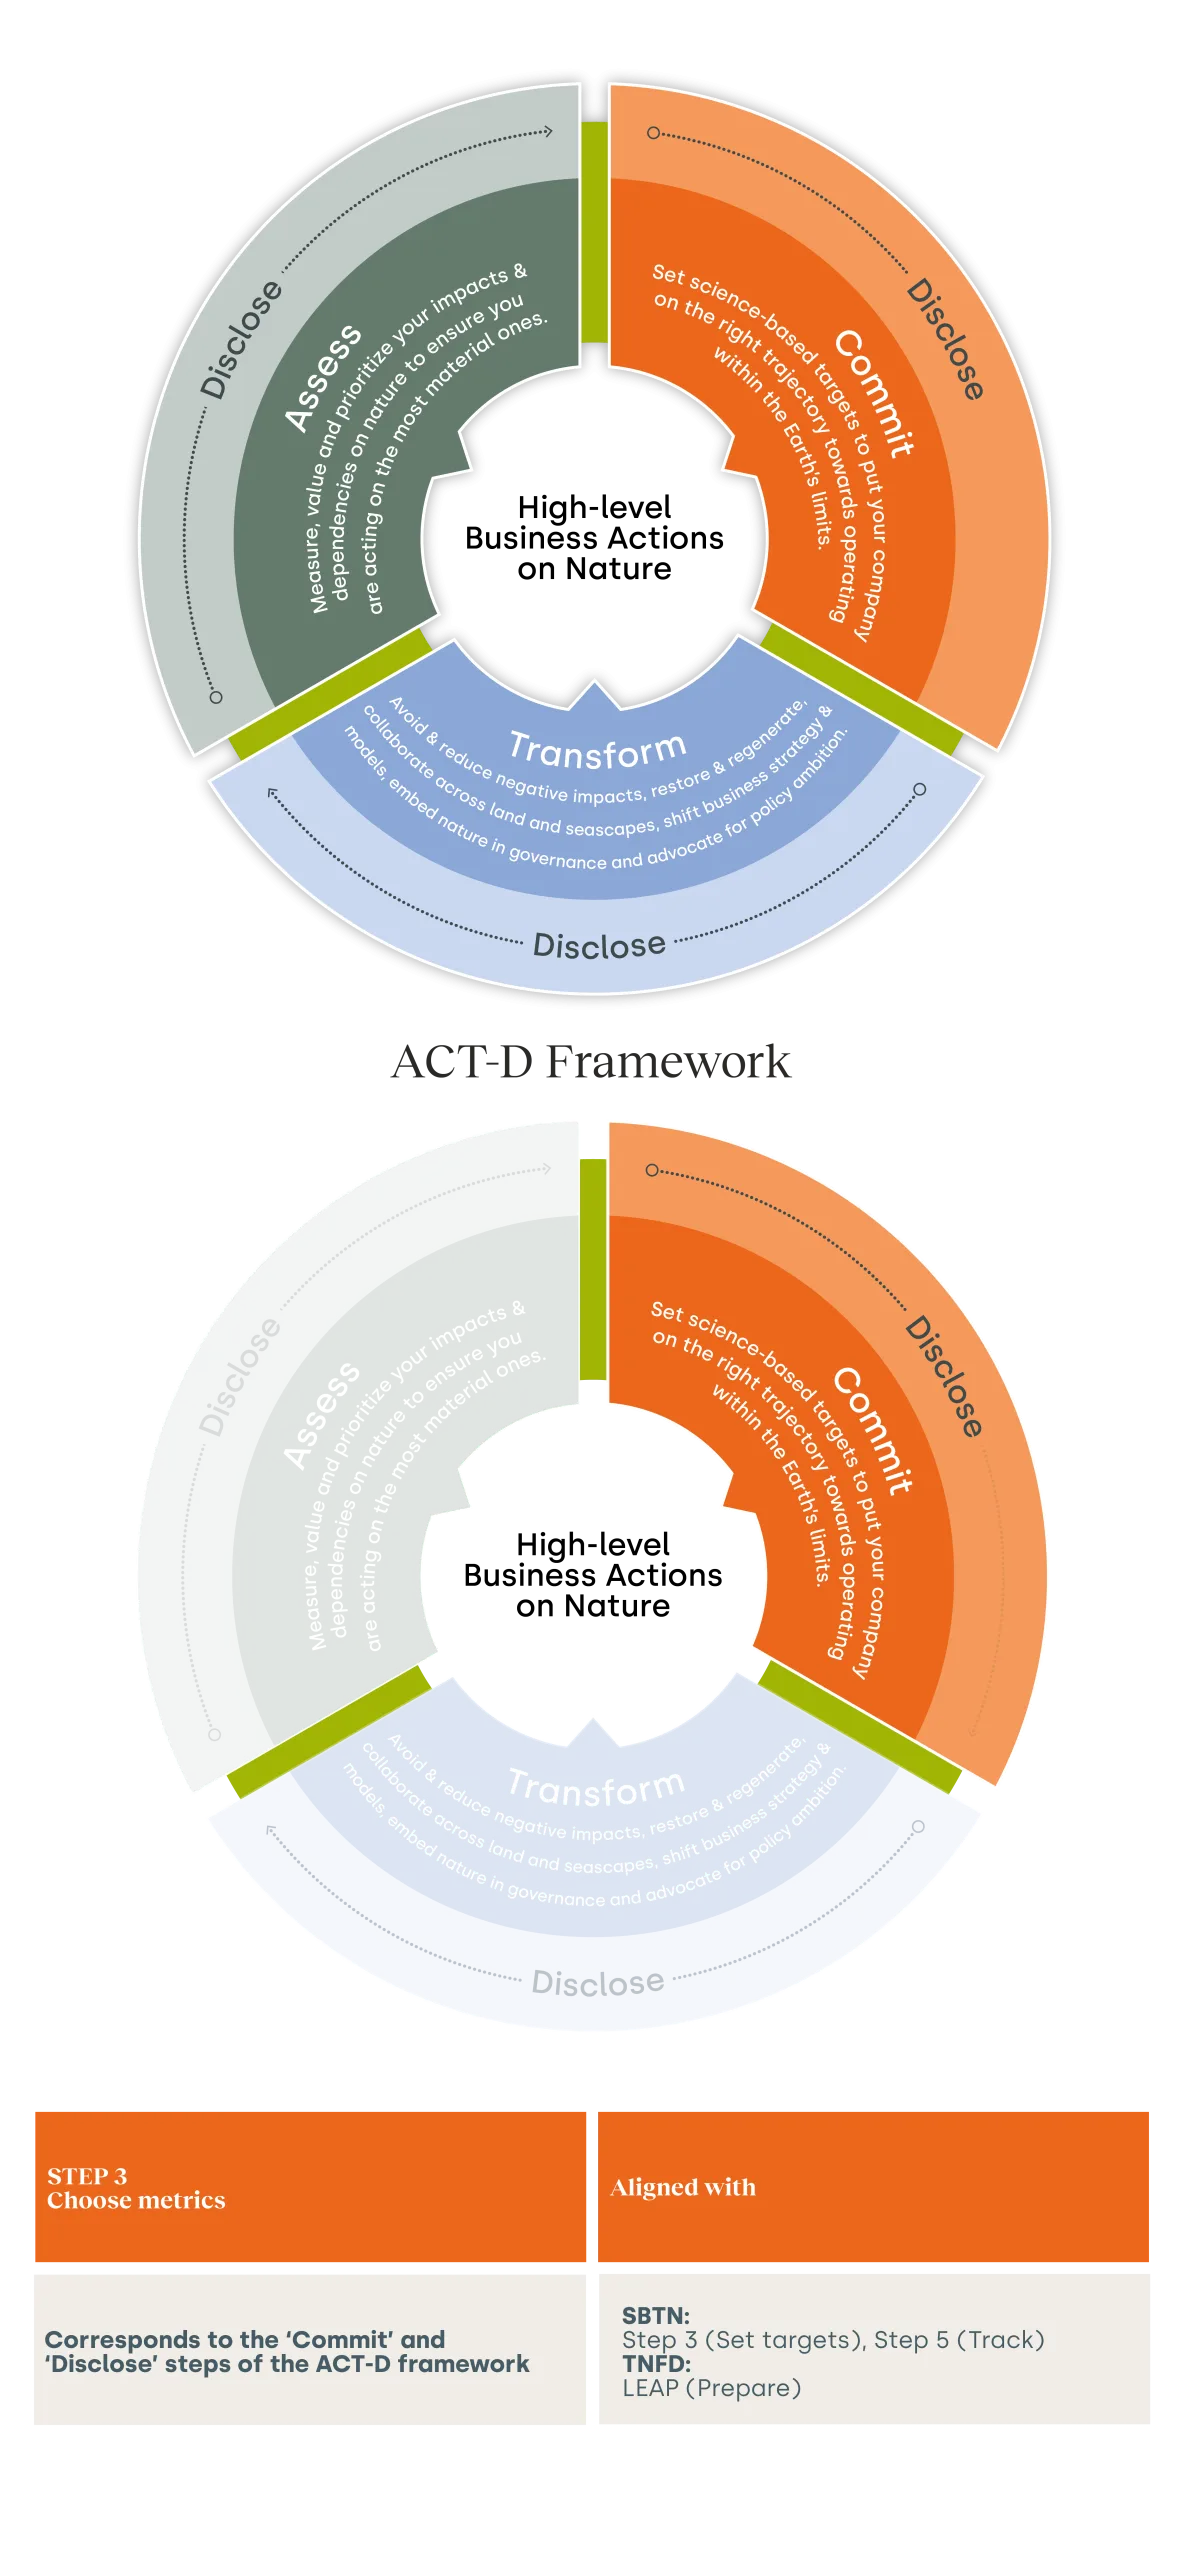
Our initiative to prioritize nature-related metrics seeks to address the critical challenges reported by member companies in advancing their nature agendas. We address these questions through four key Portal functions and outline the methodology applied to each of these functions below.
1) Prioritizing metrics
2) Aligning with relevant voluntary and regulatory frameworks
3) Driving action in the supply chain
4) Defining metrics for target-setting
1) Prioritizing metrics
Unlike climate, which has a well-established single metric – carbon dioxide equivalent (CO2e) – to measure progress, nature is more complex, with a multitude of metrics and no consensus on their relevance and applicability.
The Portal’s main purpose is to guide practitioners in navigating the vast array of metrics, helping them focus on those most relevant to their sector and specific business model.
The Portal features three categories of metrics – state of nature, pressure and response metrics – as defined in the diagram below.
The three categories of metrics and their interactions
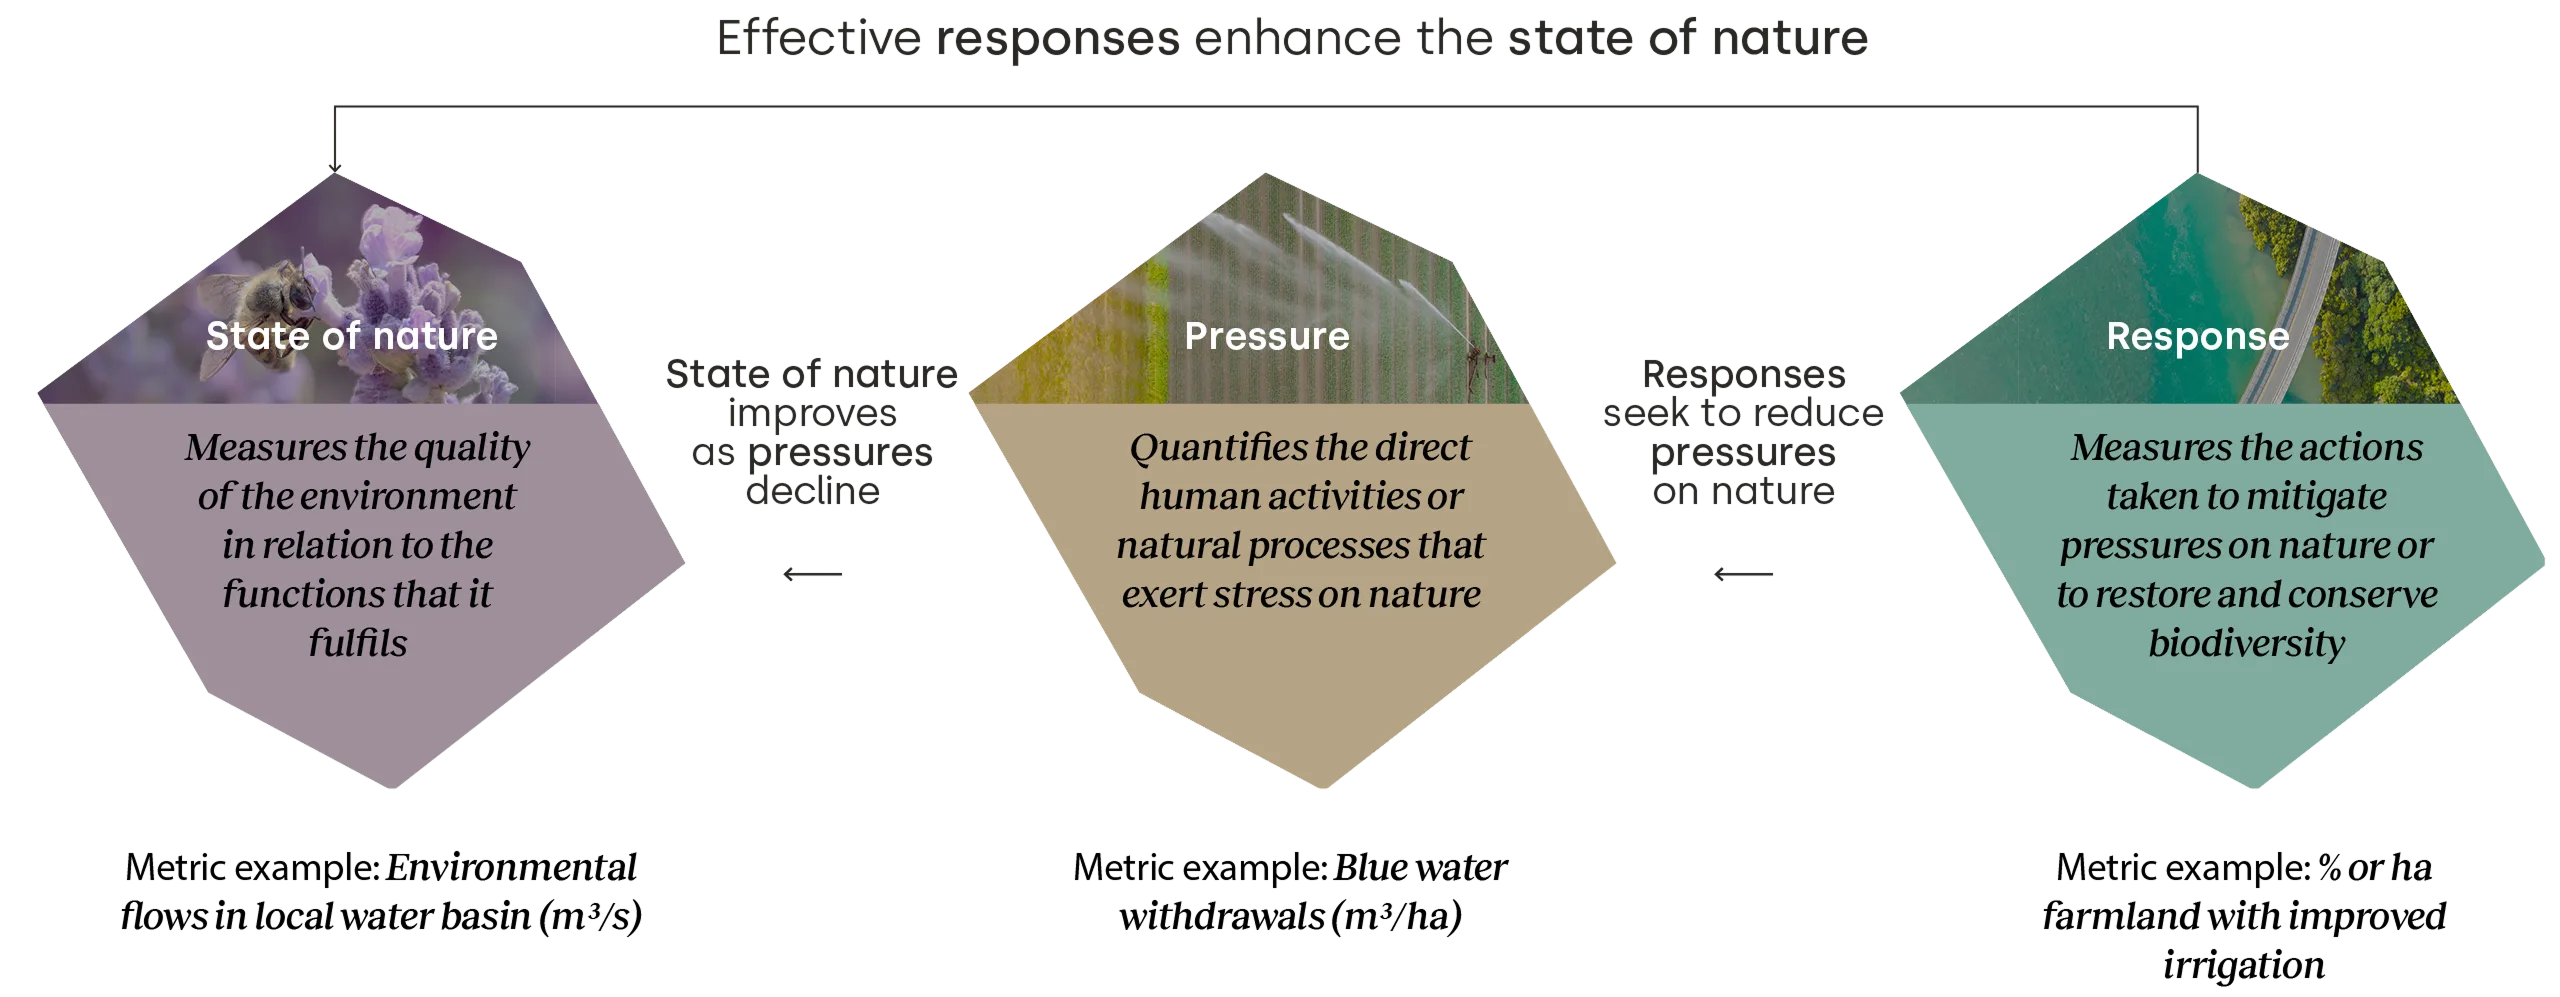
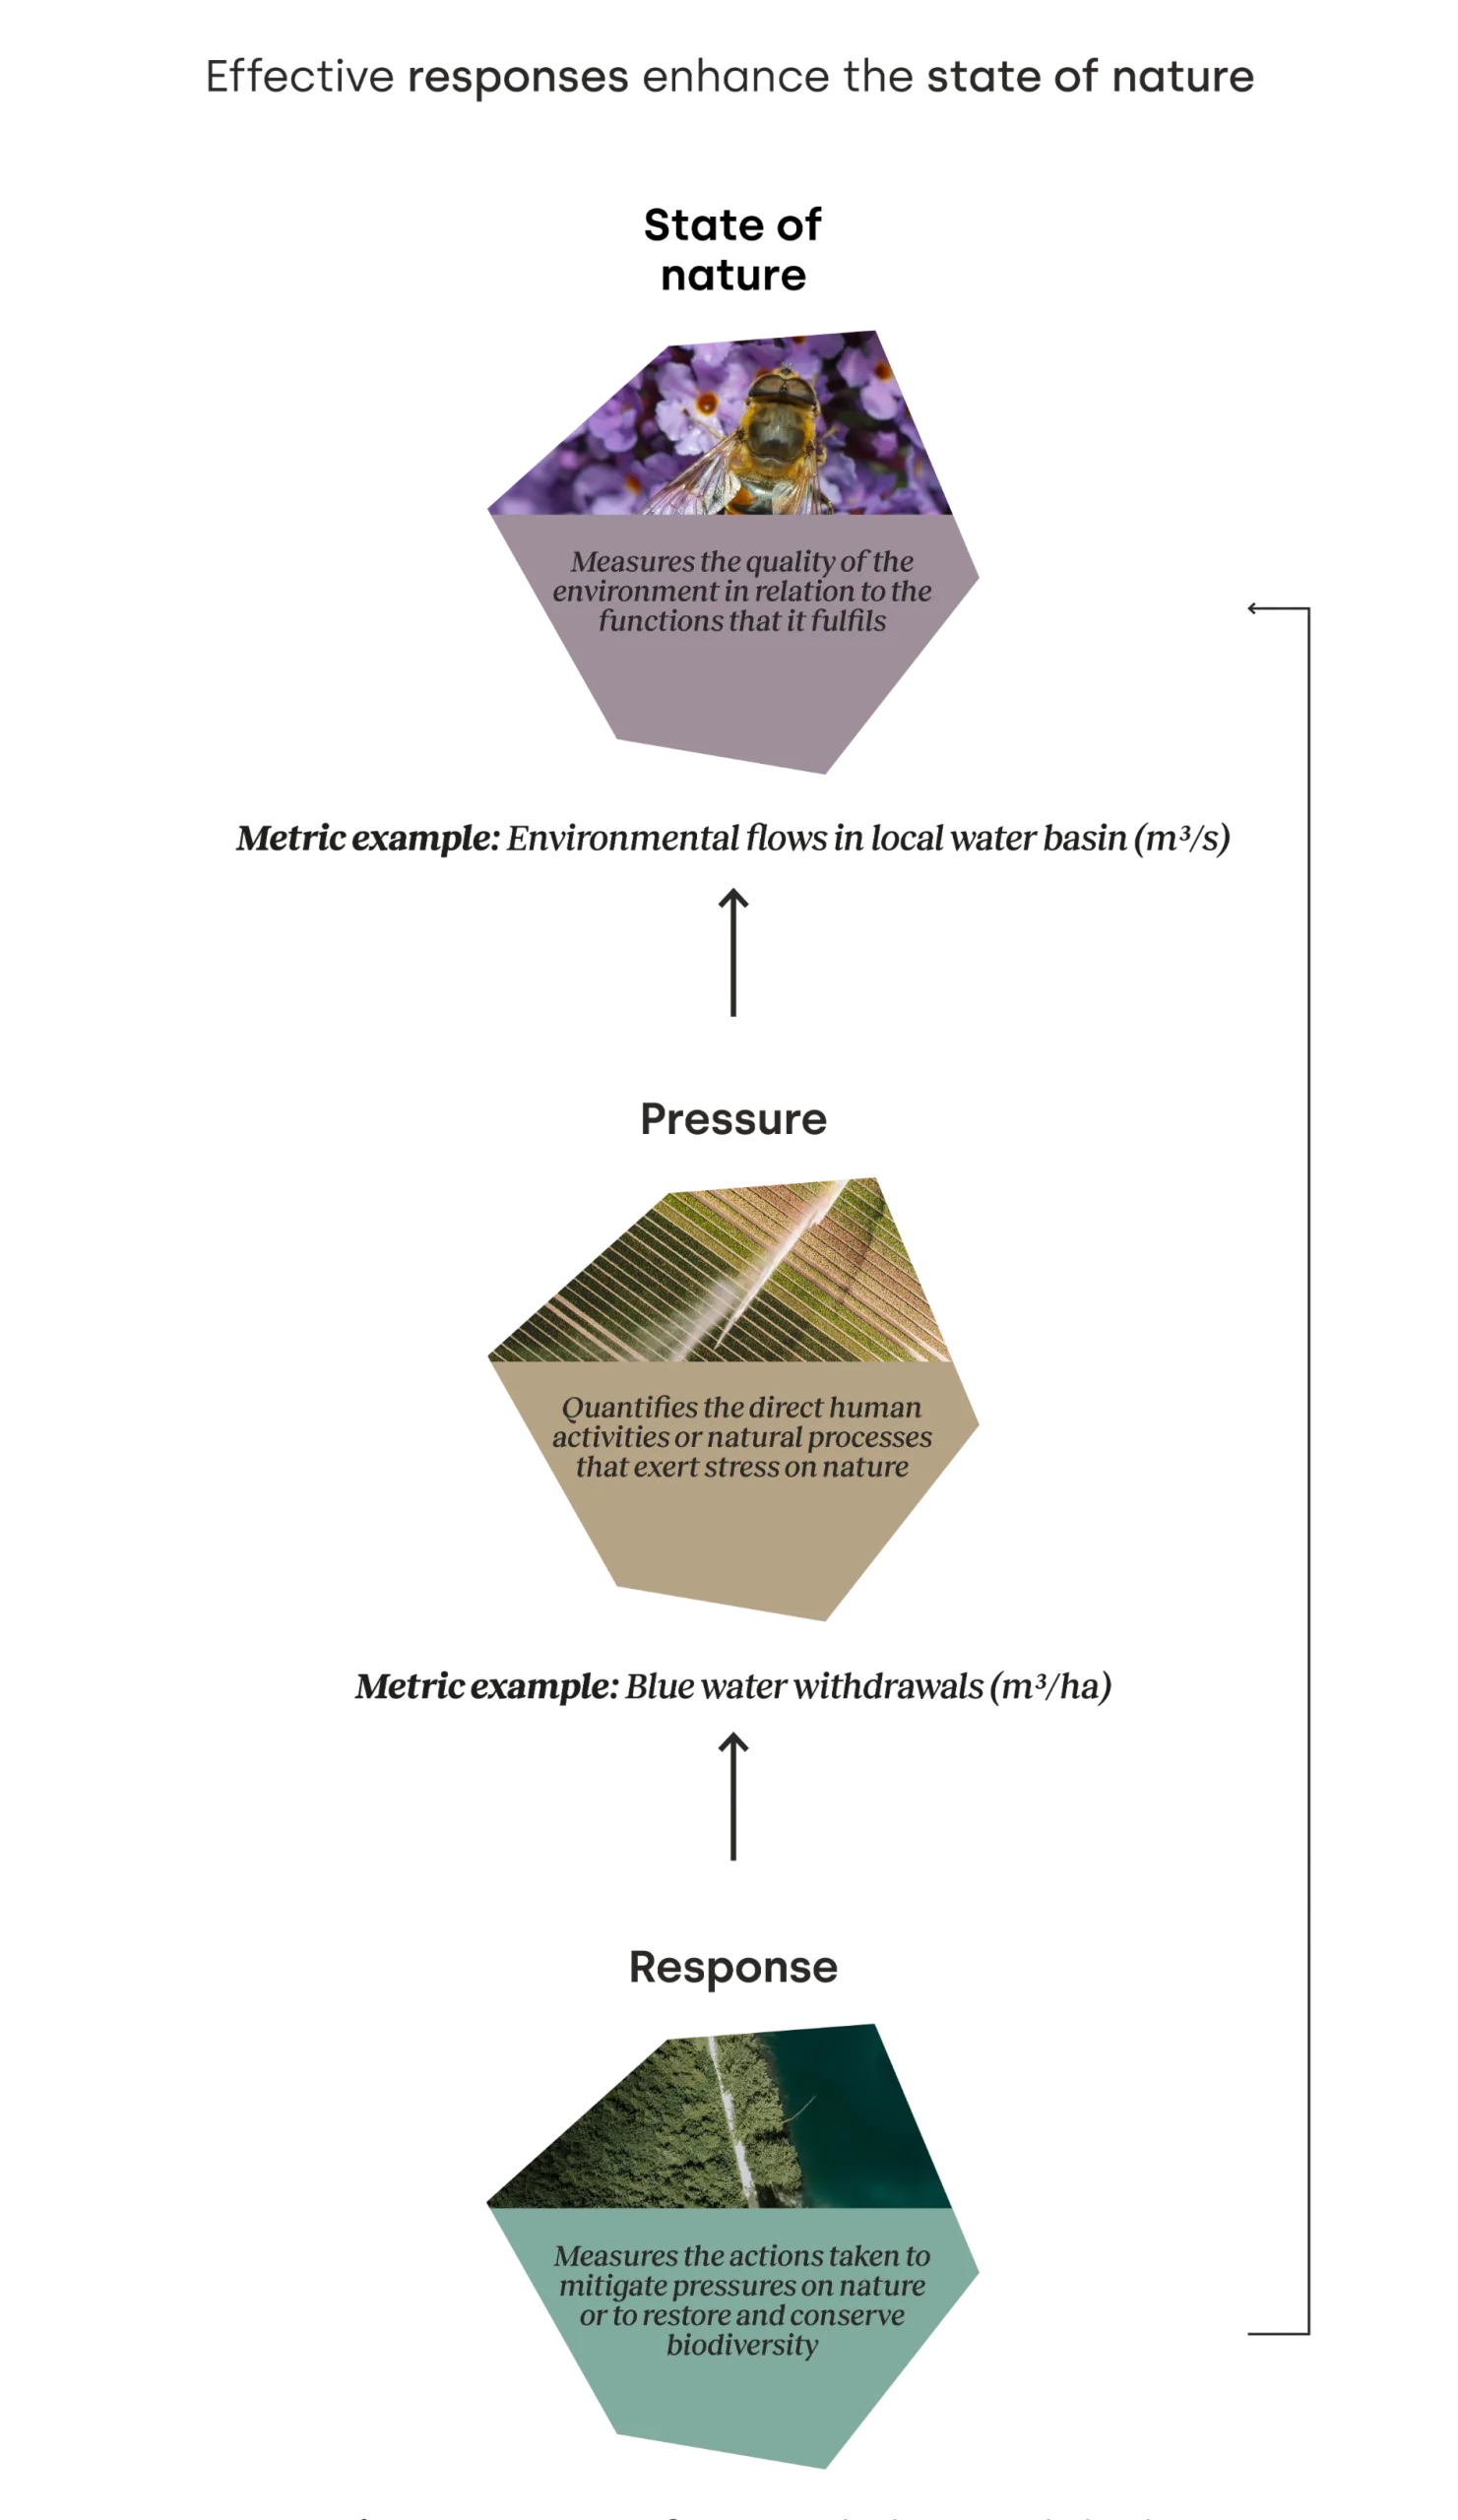
While some metrics apply across all sectors (such as water withdrawal and consumption from areas of water scarcity, area of degraded land restored) others are sector-specific (like soil organic material, amount of nuclear waste permanently and safely stored).
The Portal does not distinguish between different purposes of metrics (e.g., decision-making or disclosure), as these boundaries are often fluid and may vary depending on the specific context.
To support the users in finding the right metrics, we have prioritized the initial long list of metrics at two levels.
The first level of prioritization involves linking the metrics to actions that address the most significant impacts and dependencies in a particular sector or system. As described under STEP 2 – Plan actions, we used the five Intergovernmental Science-Policy Platform on Biodiversity and Ecosystem Services (IPBES) drivers of nature loss to identify the most material impacts and dependencies for each sector or system.
Then we developed a comprehensive list of actions to address these impacts and dependencies, with each action linked to specific metrics.
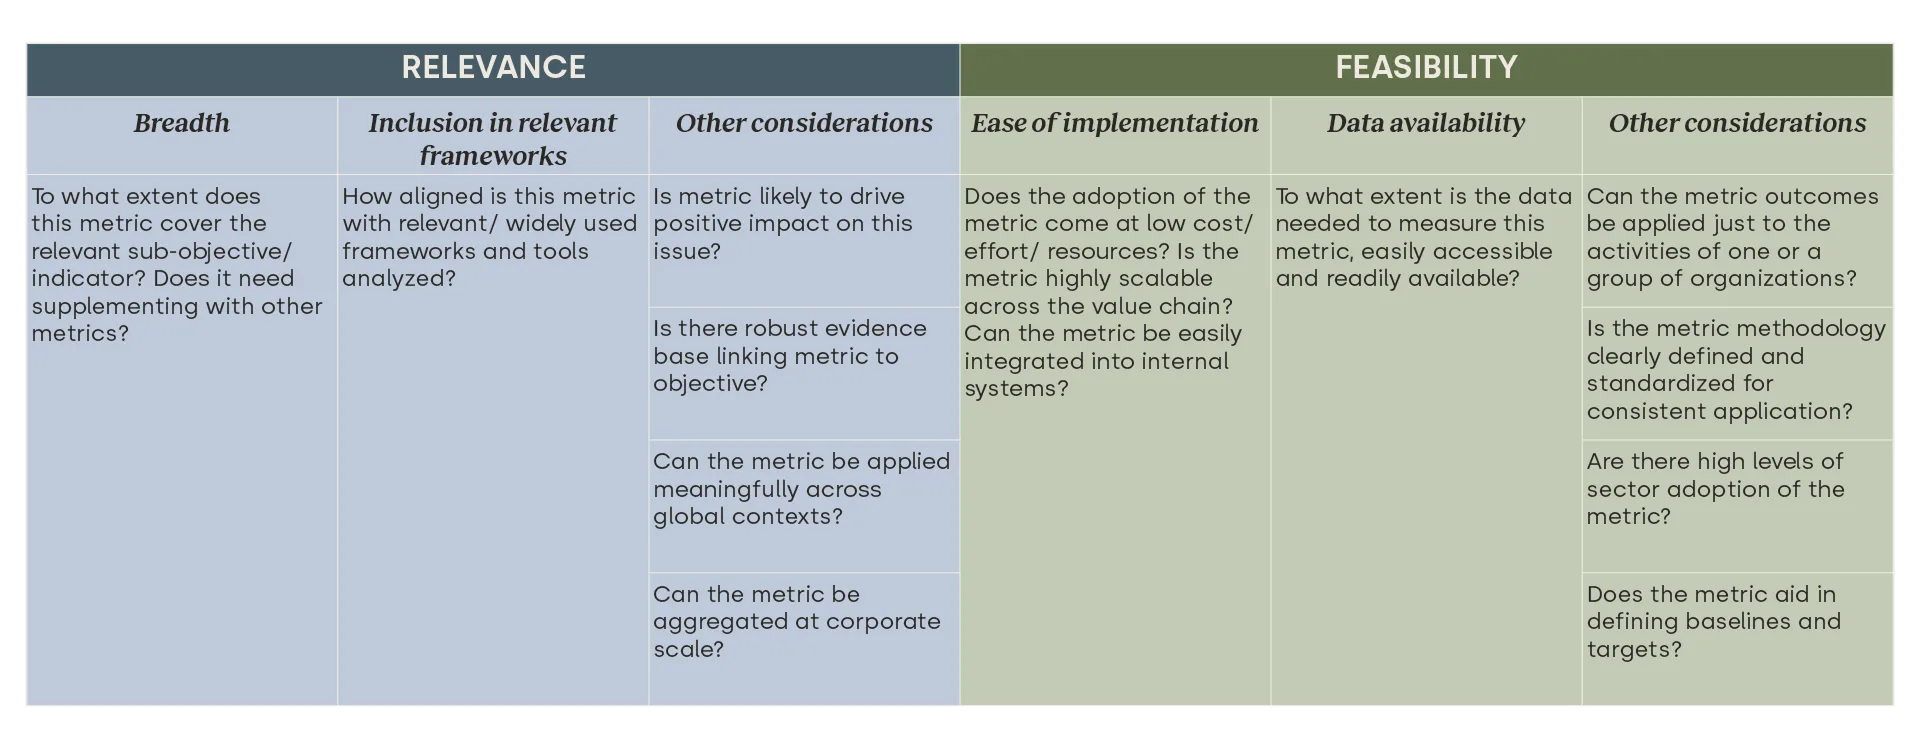
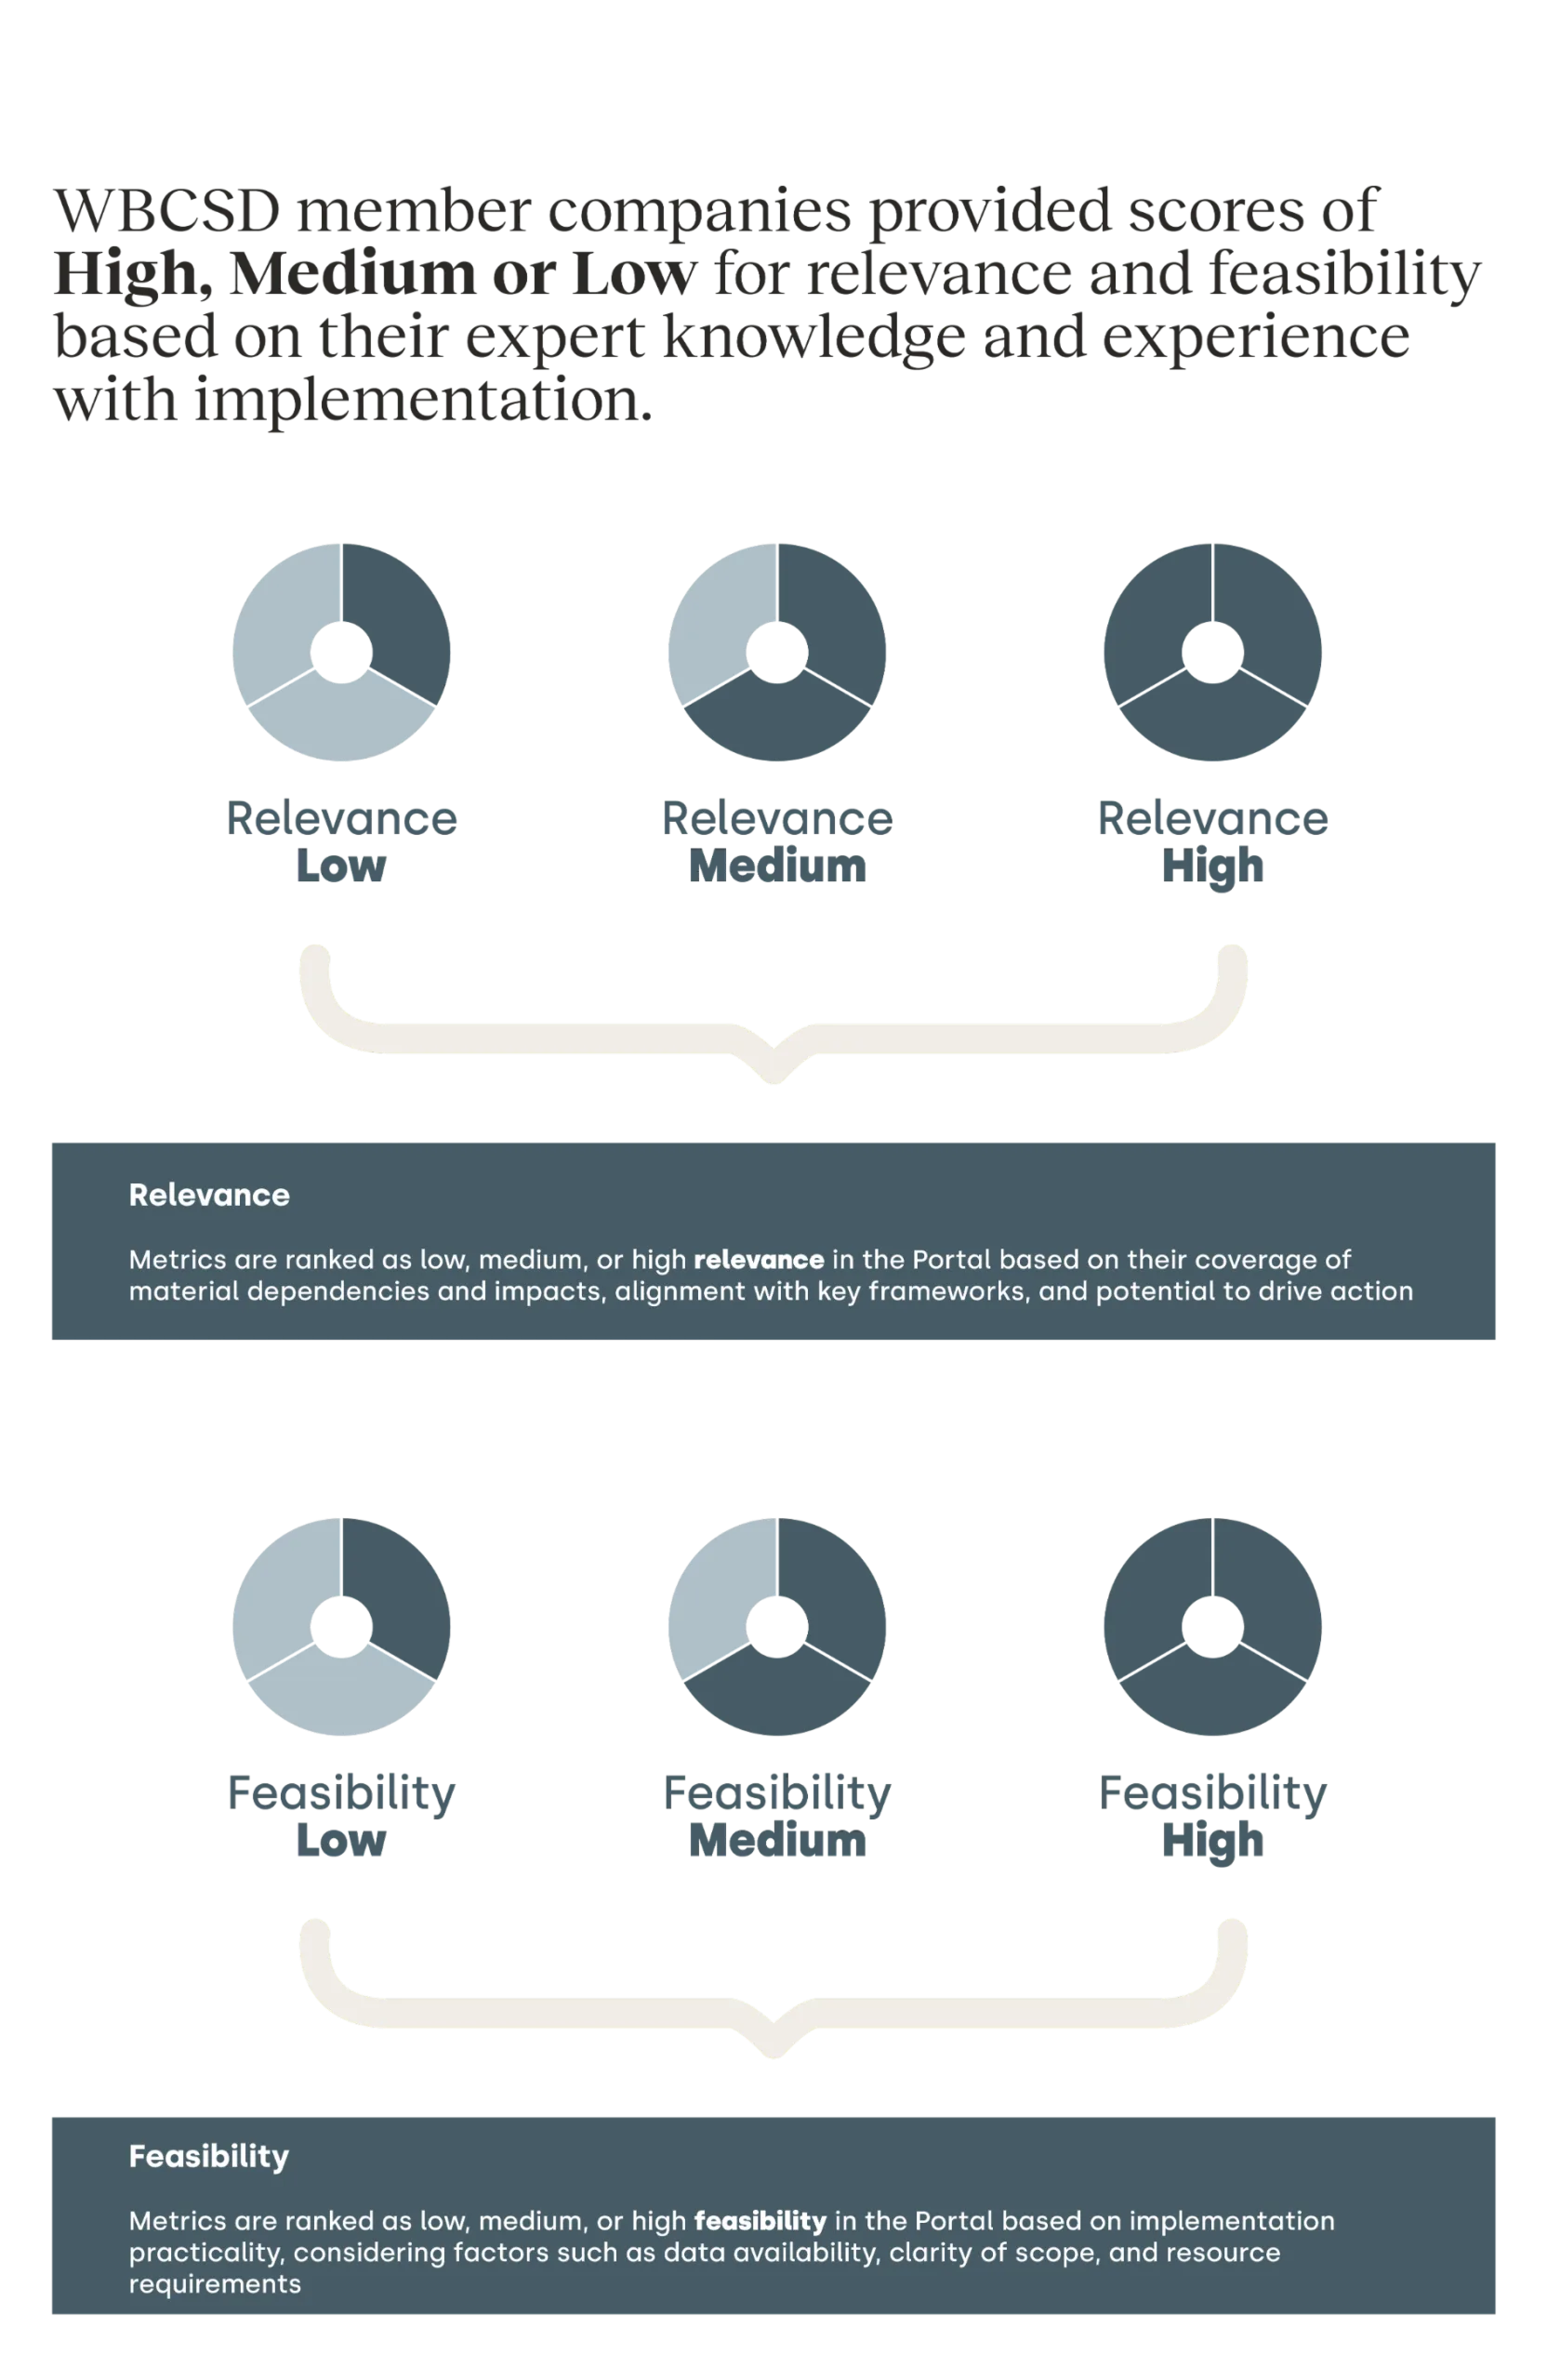
To further refine the list of metrics available to users, a second level of prioritization involves evaluating each metric’s relevance and feasibility of implementation based on the criteria outlined in the diagram below.
The relevance criteria reflect how well a metric considers material dependencies and impacts, aligns with key frameworks, and has the potential to drive action.
The feasibility criteria consider the practicality of implementation, including data availability, clarity of scope, and resource requirements.
The diagram describes the prompts used for the relevance and feasibility assessment.
Prompts used for the scoring of metric relevance and feasibility
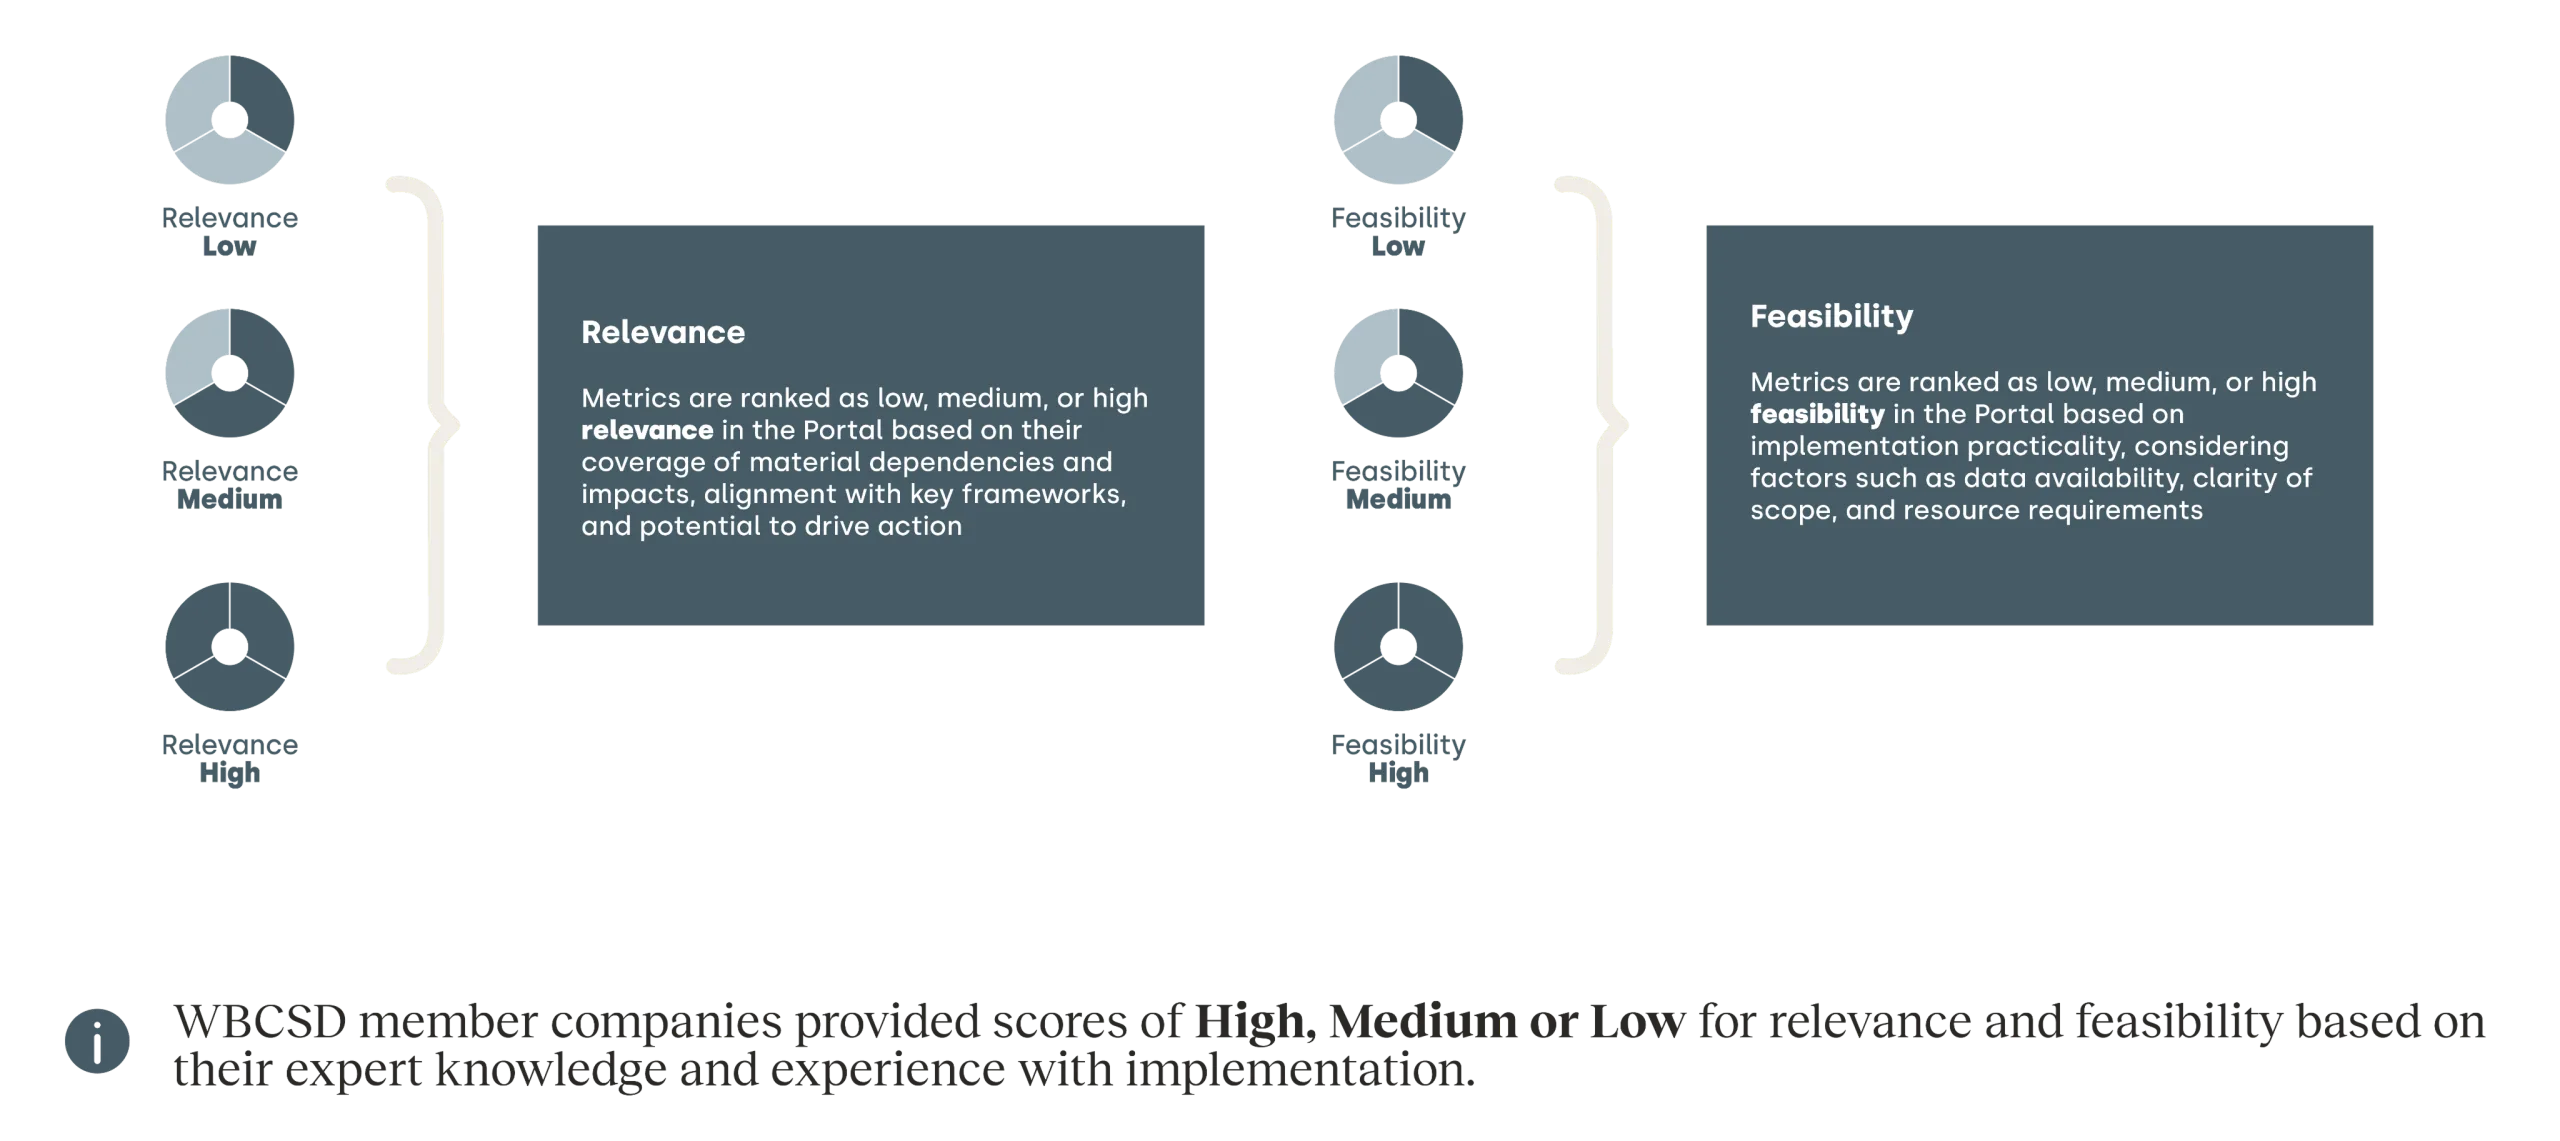
The diagram below illustrates how to interpret the relevance and feasibility scoring that appears in the Portal.
Degree of relevance and feasibility of metrics
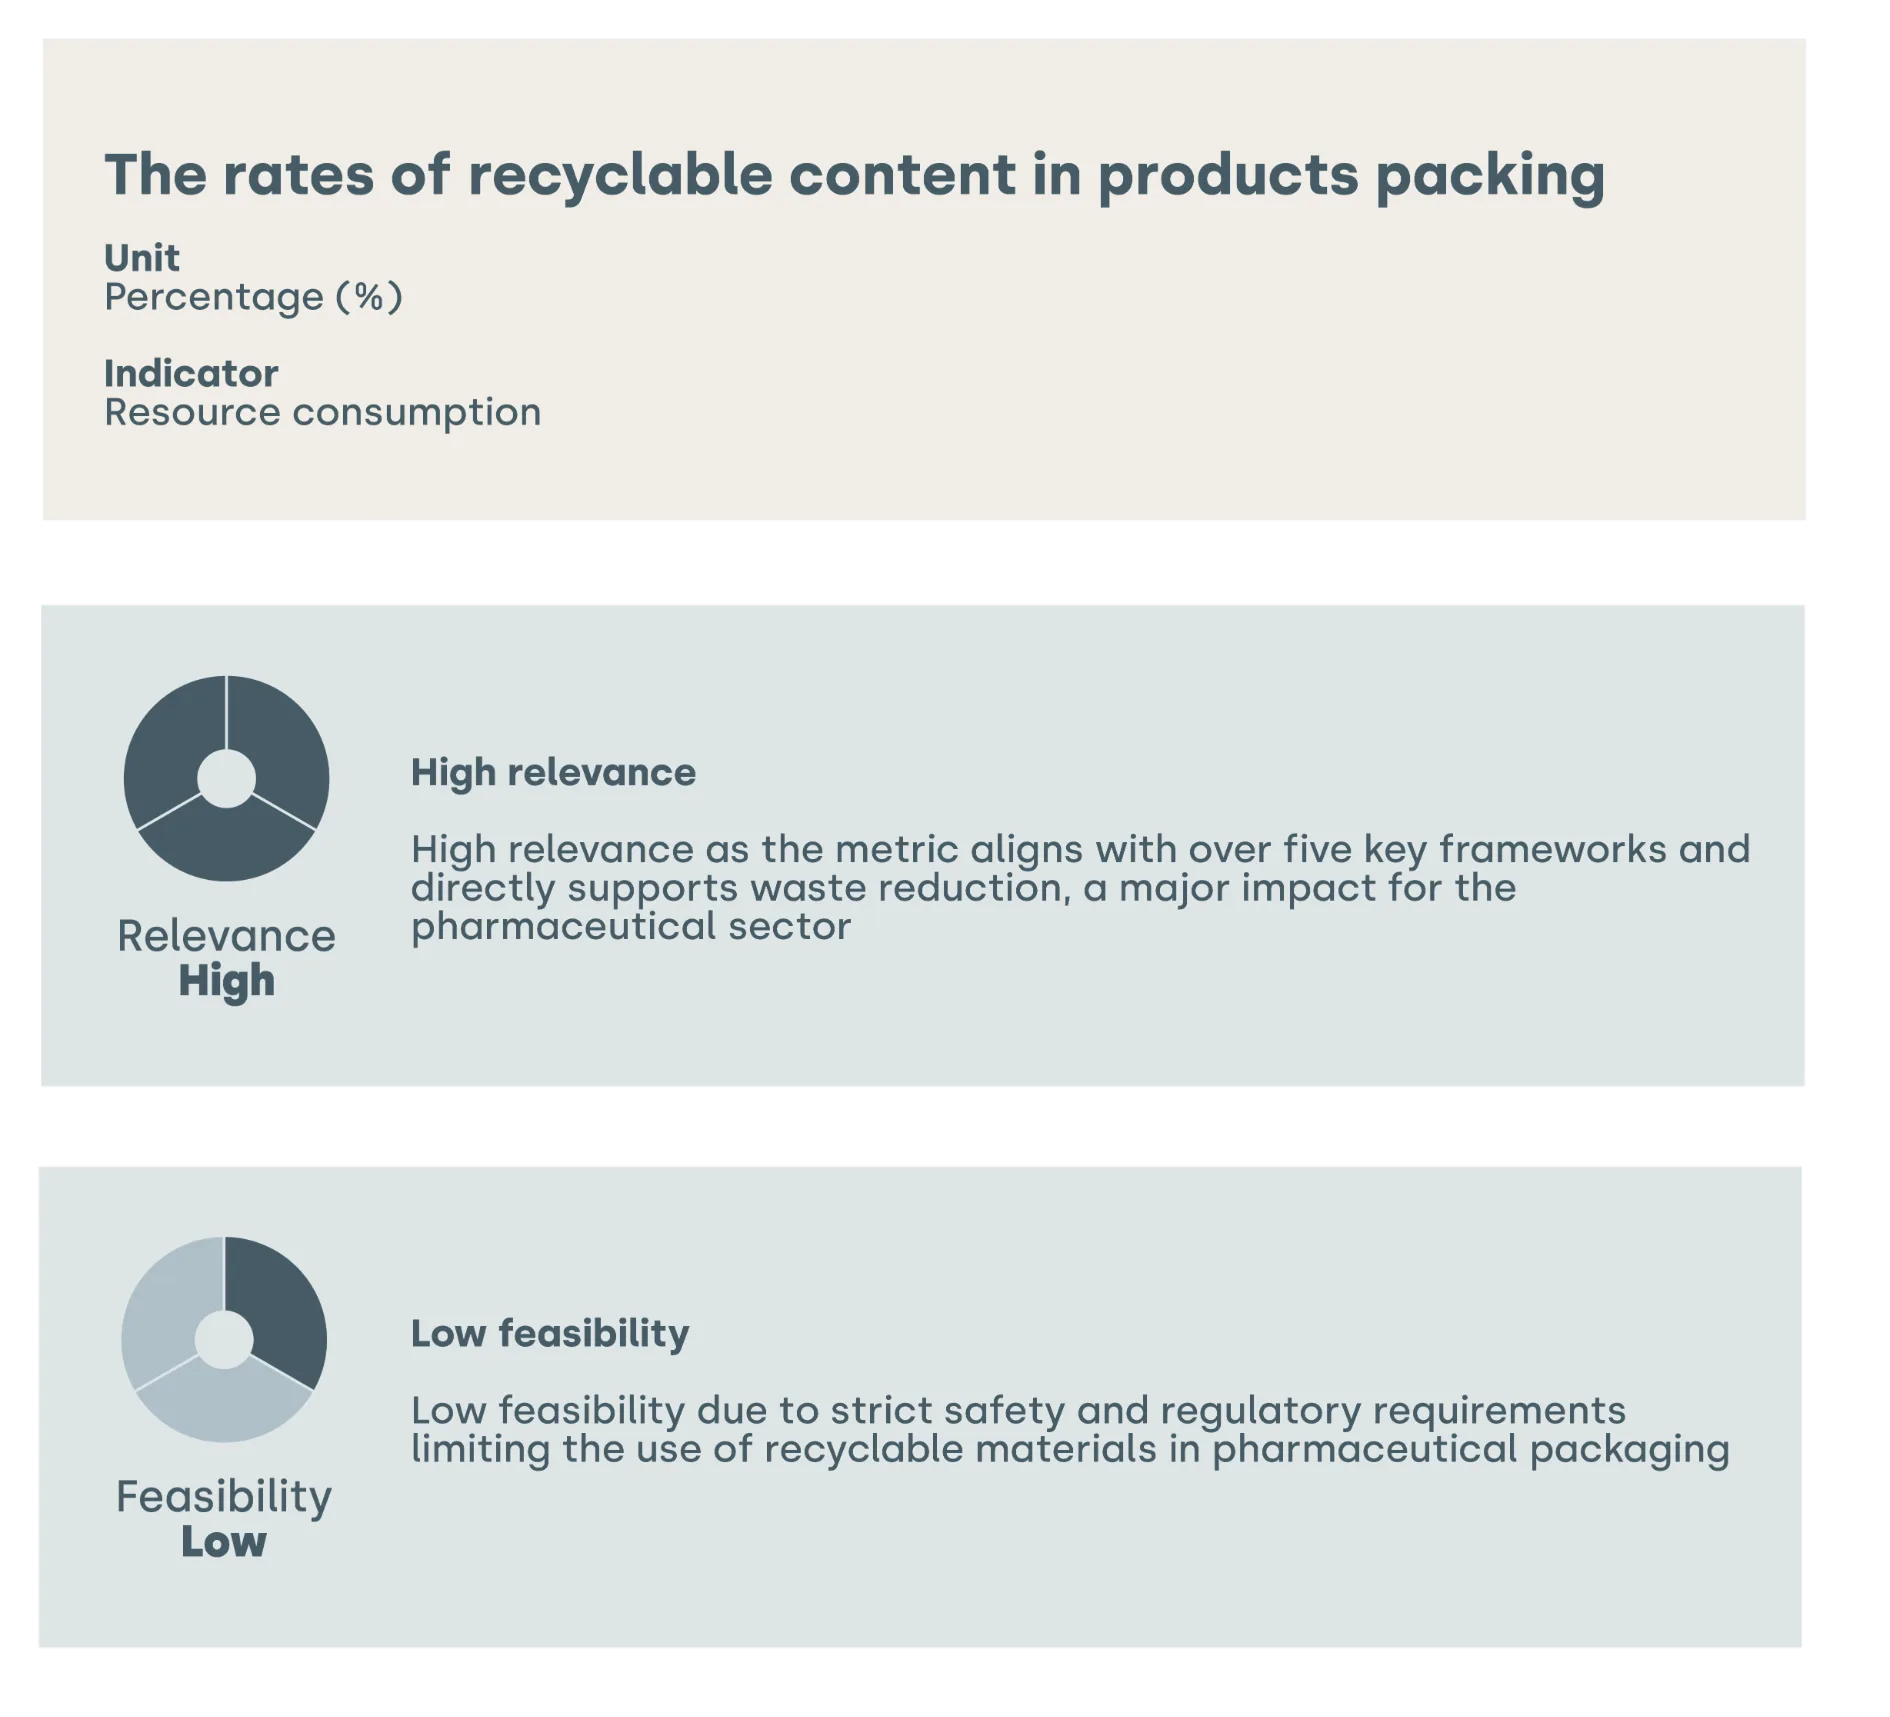
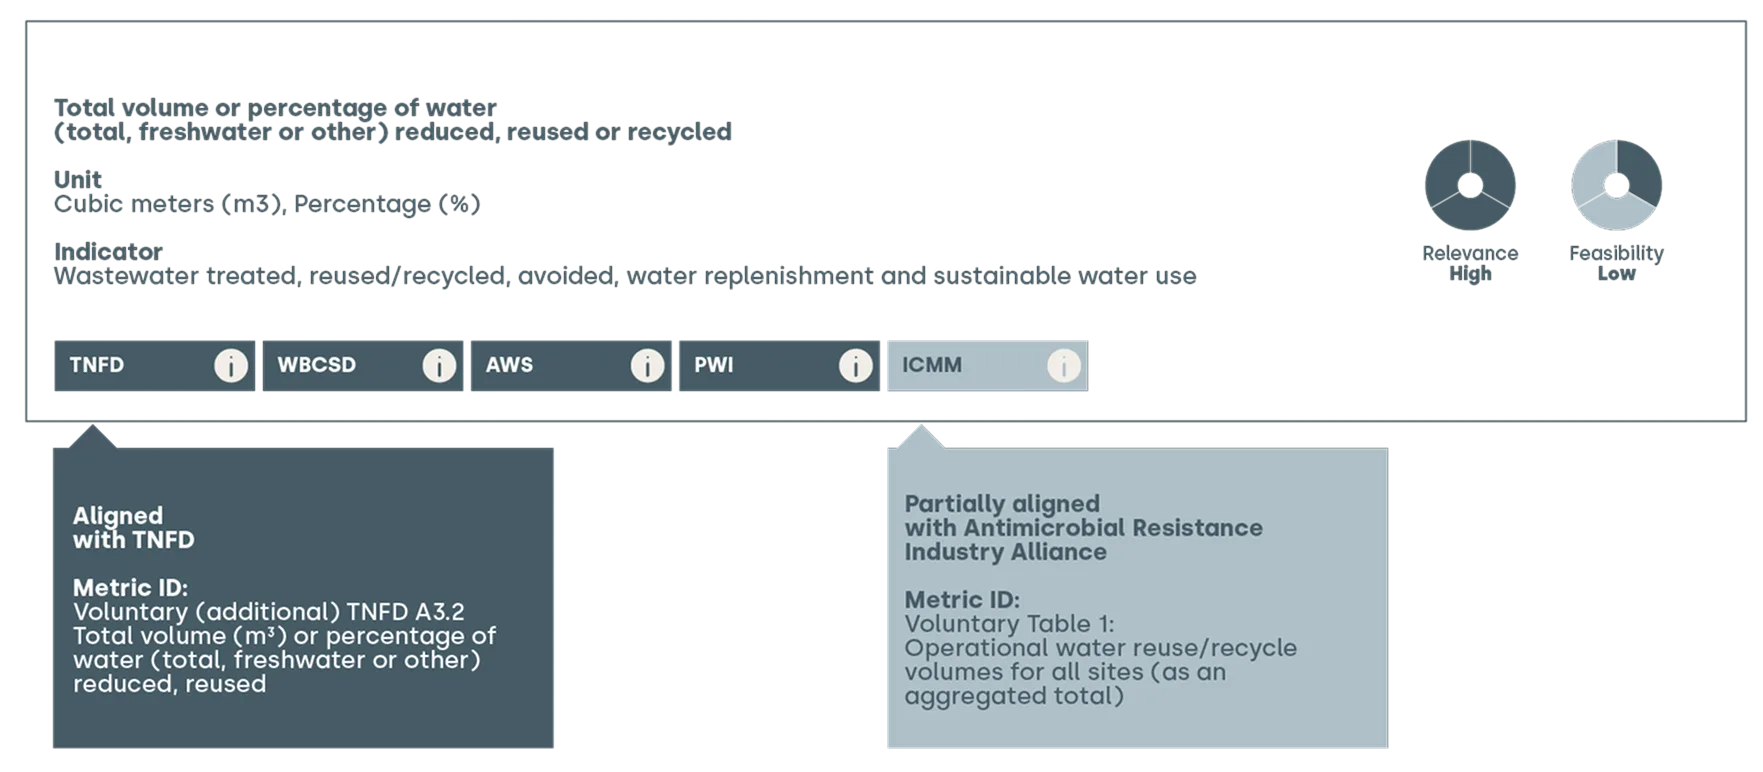
To illustrate this process, the following diagram provides an example of a metric identified as highly relevant but with lower feasibility for the pharmaceutical sector.
Relevance and feasibility of a metric linked to the pharmaceutical sector (example)

We have sourced the metrics featured in the Portal exclusively from existing frameworks identified by the working group as the most relevant. We have introduced no new metrics. The Portal currently features more than 550 metrics across all sectors. These represent a subset of the broader set of nature-related metrics initially identified as the metrics that scored ‘Low’ for relevance and feasibility. We have not included them in the Portal. The scores reflect the conditions at the time of the assessment and will evolve over time due to factors such as technology advances and data availability.
The metrics scoring for each metric is based on consultations with 1) members of the sector working groups – typically between 10 to 25 leading companies in the sector;
2) the service providers responsible for leading the work for each sector group; 3) a group of external stakeholders, such as NGOs, academics, and industry associations. Please see the Acknowledgements section for the name of the organisations involved in each working group.
We invite users to share feedback on the scoring through the feedback form available on the metric pages.
We further categorize the metrics in the Portal by indicators. These are available as filters on the main metric page. The indicators are quantitative or qualitative factors measurable with one or more metrics.
For example, the indicator “Water consumption and withdrawal” ties to metrics such as blue water withdrawals (m3), total water withdrawals (m3), and water withdrawal and consumption from areas of water scarcity (m3).
The indicators in the Nature Action Portal include state of nature, pressure and response indicators. They align with TNFD indicators where possible. When the indicator aggregates several TNFD indicators, the wording of the Portal’s indicator aligns as much as possible with that of the TNFD indicators collectively.
2) Aligning with key voluntary and regulatory frameworks
Despite recent progress, there is still a lack of widely adopted nature-related metrics that allow for consistent comparisons across companies using comparable datasets.
The Portal aims to help bridge this transitional gap as the corporate accountability system for nature continues to evolve and consolidate. This will help sustainability practitioners navigate the landscape of standards and regulations while clarifying how they interconnect.
We have sourced the metrics featured in the Portal exclusively from existing frameworks identified by the working group as the most relevant. We have introduced no new metrics.
While some frameworks are cross-sectoral, others are specific to a particular sector. A full list of frameworks applicable to each sector is available on the Frameworks page.
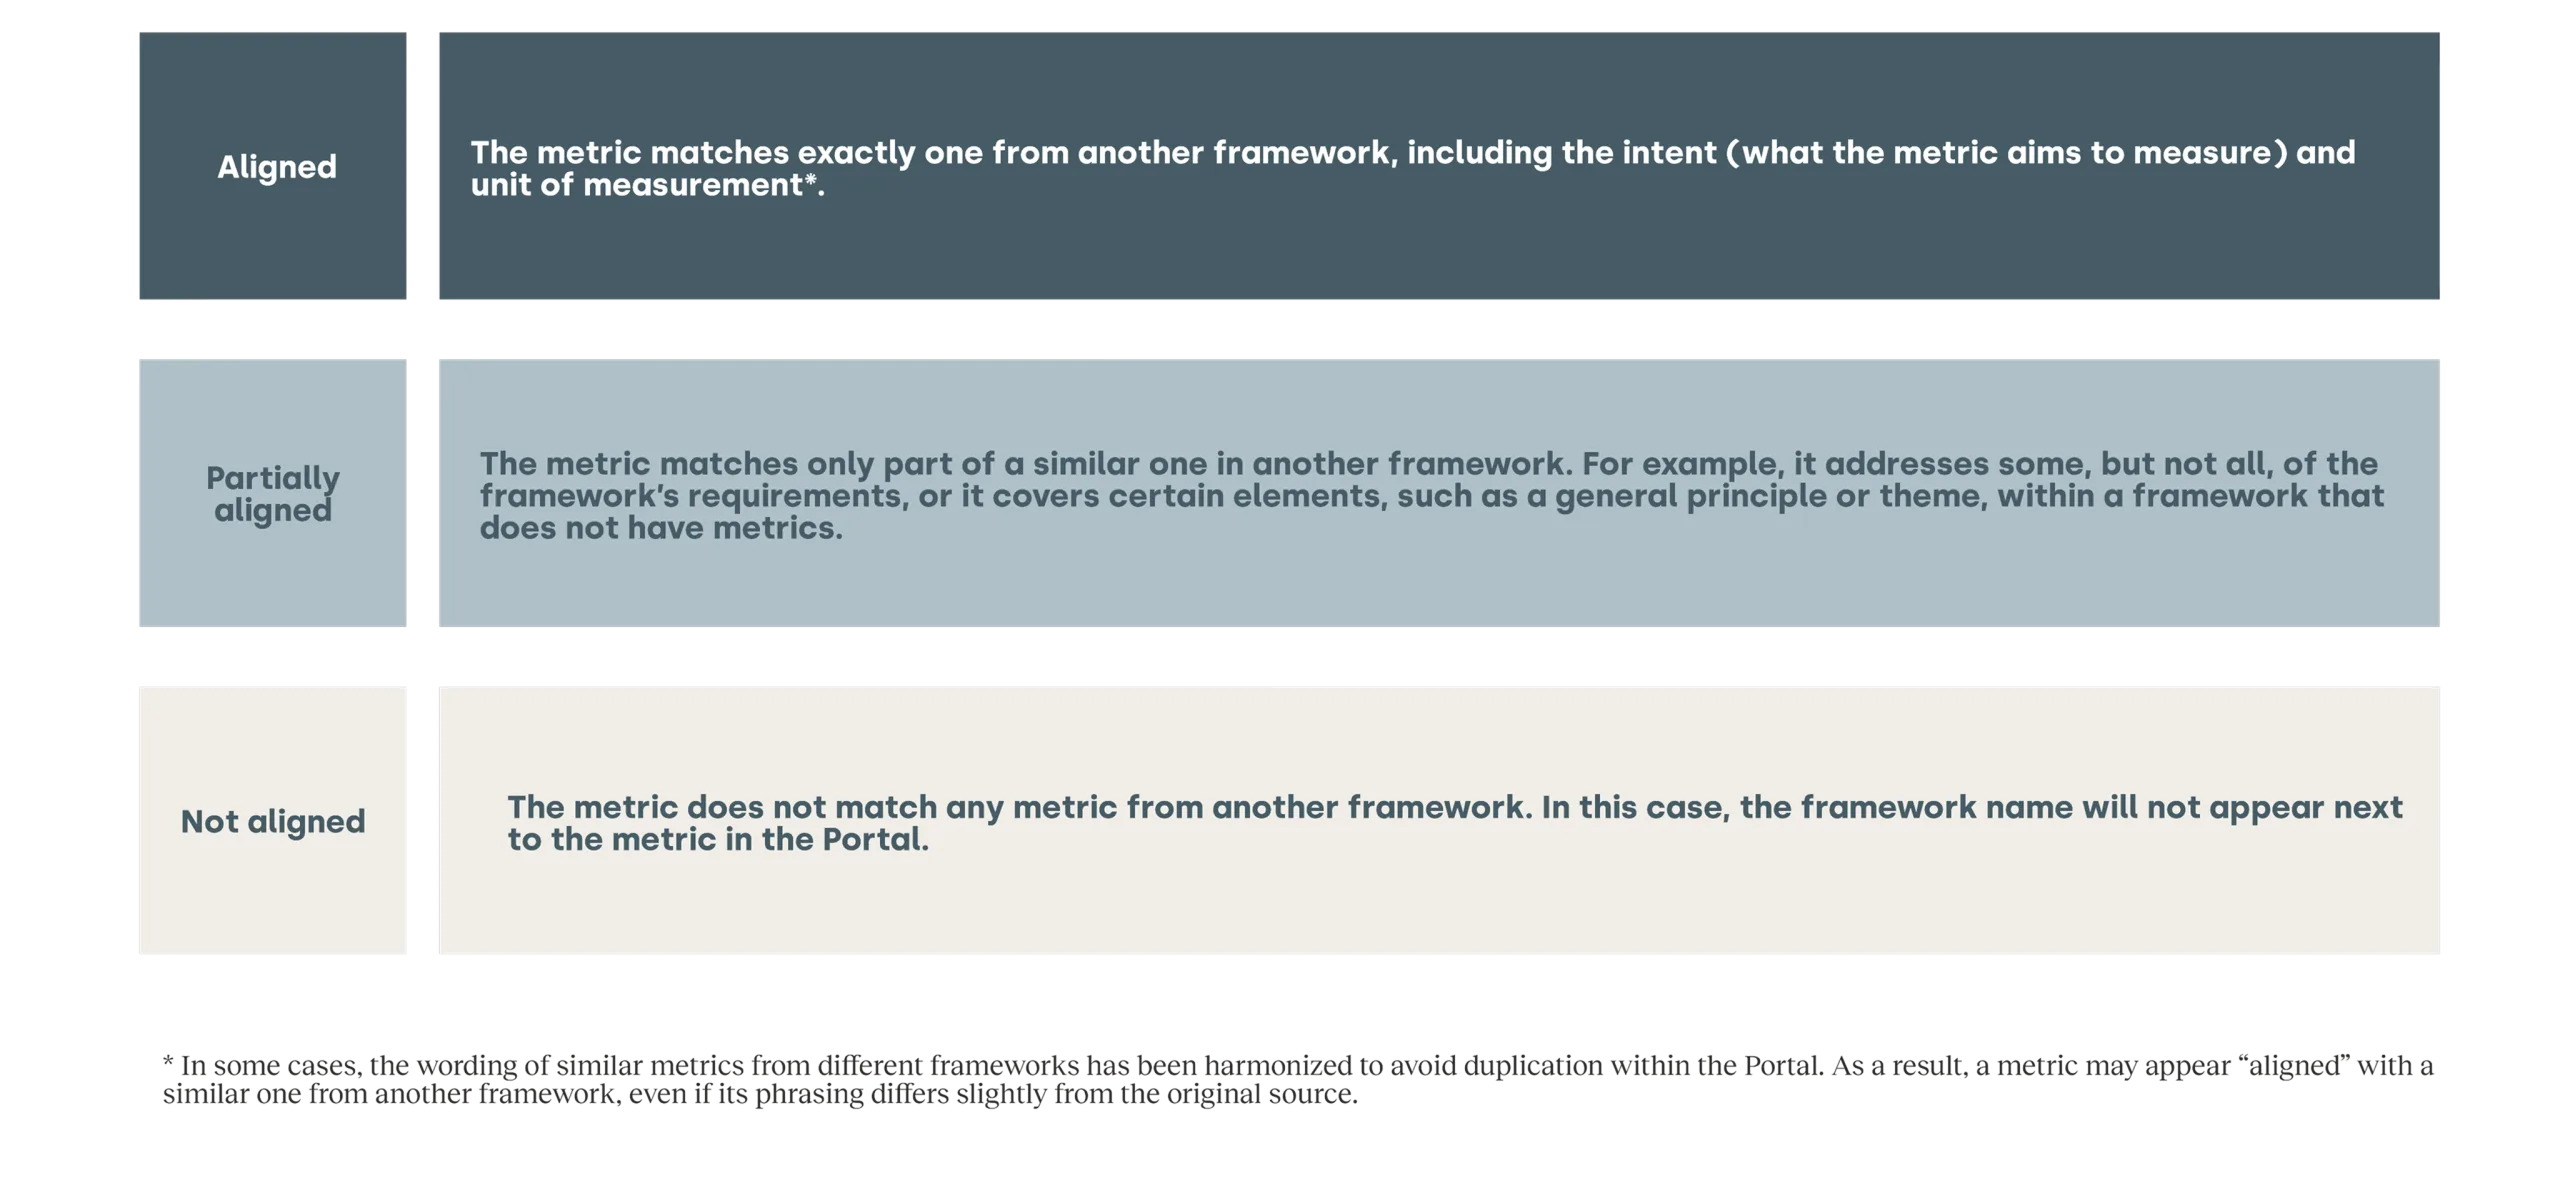
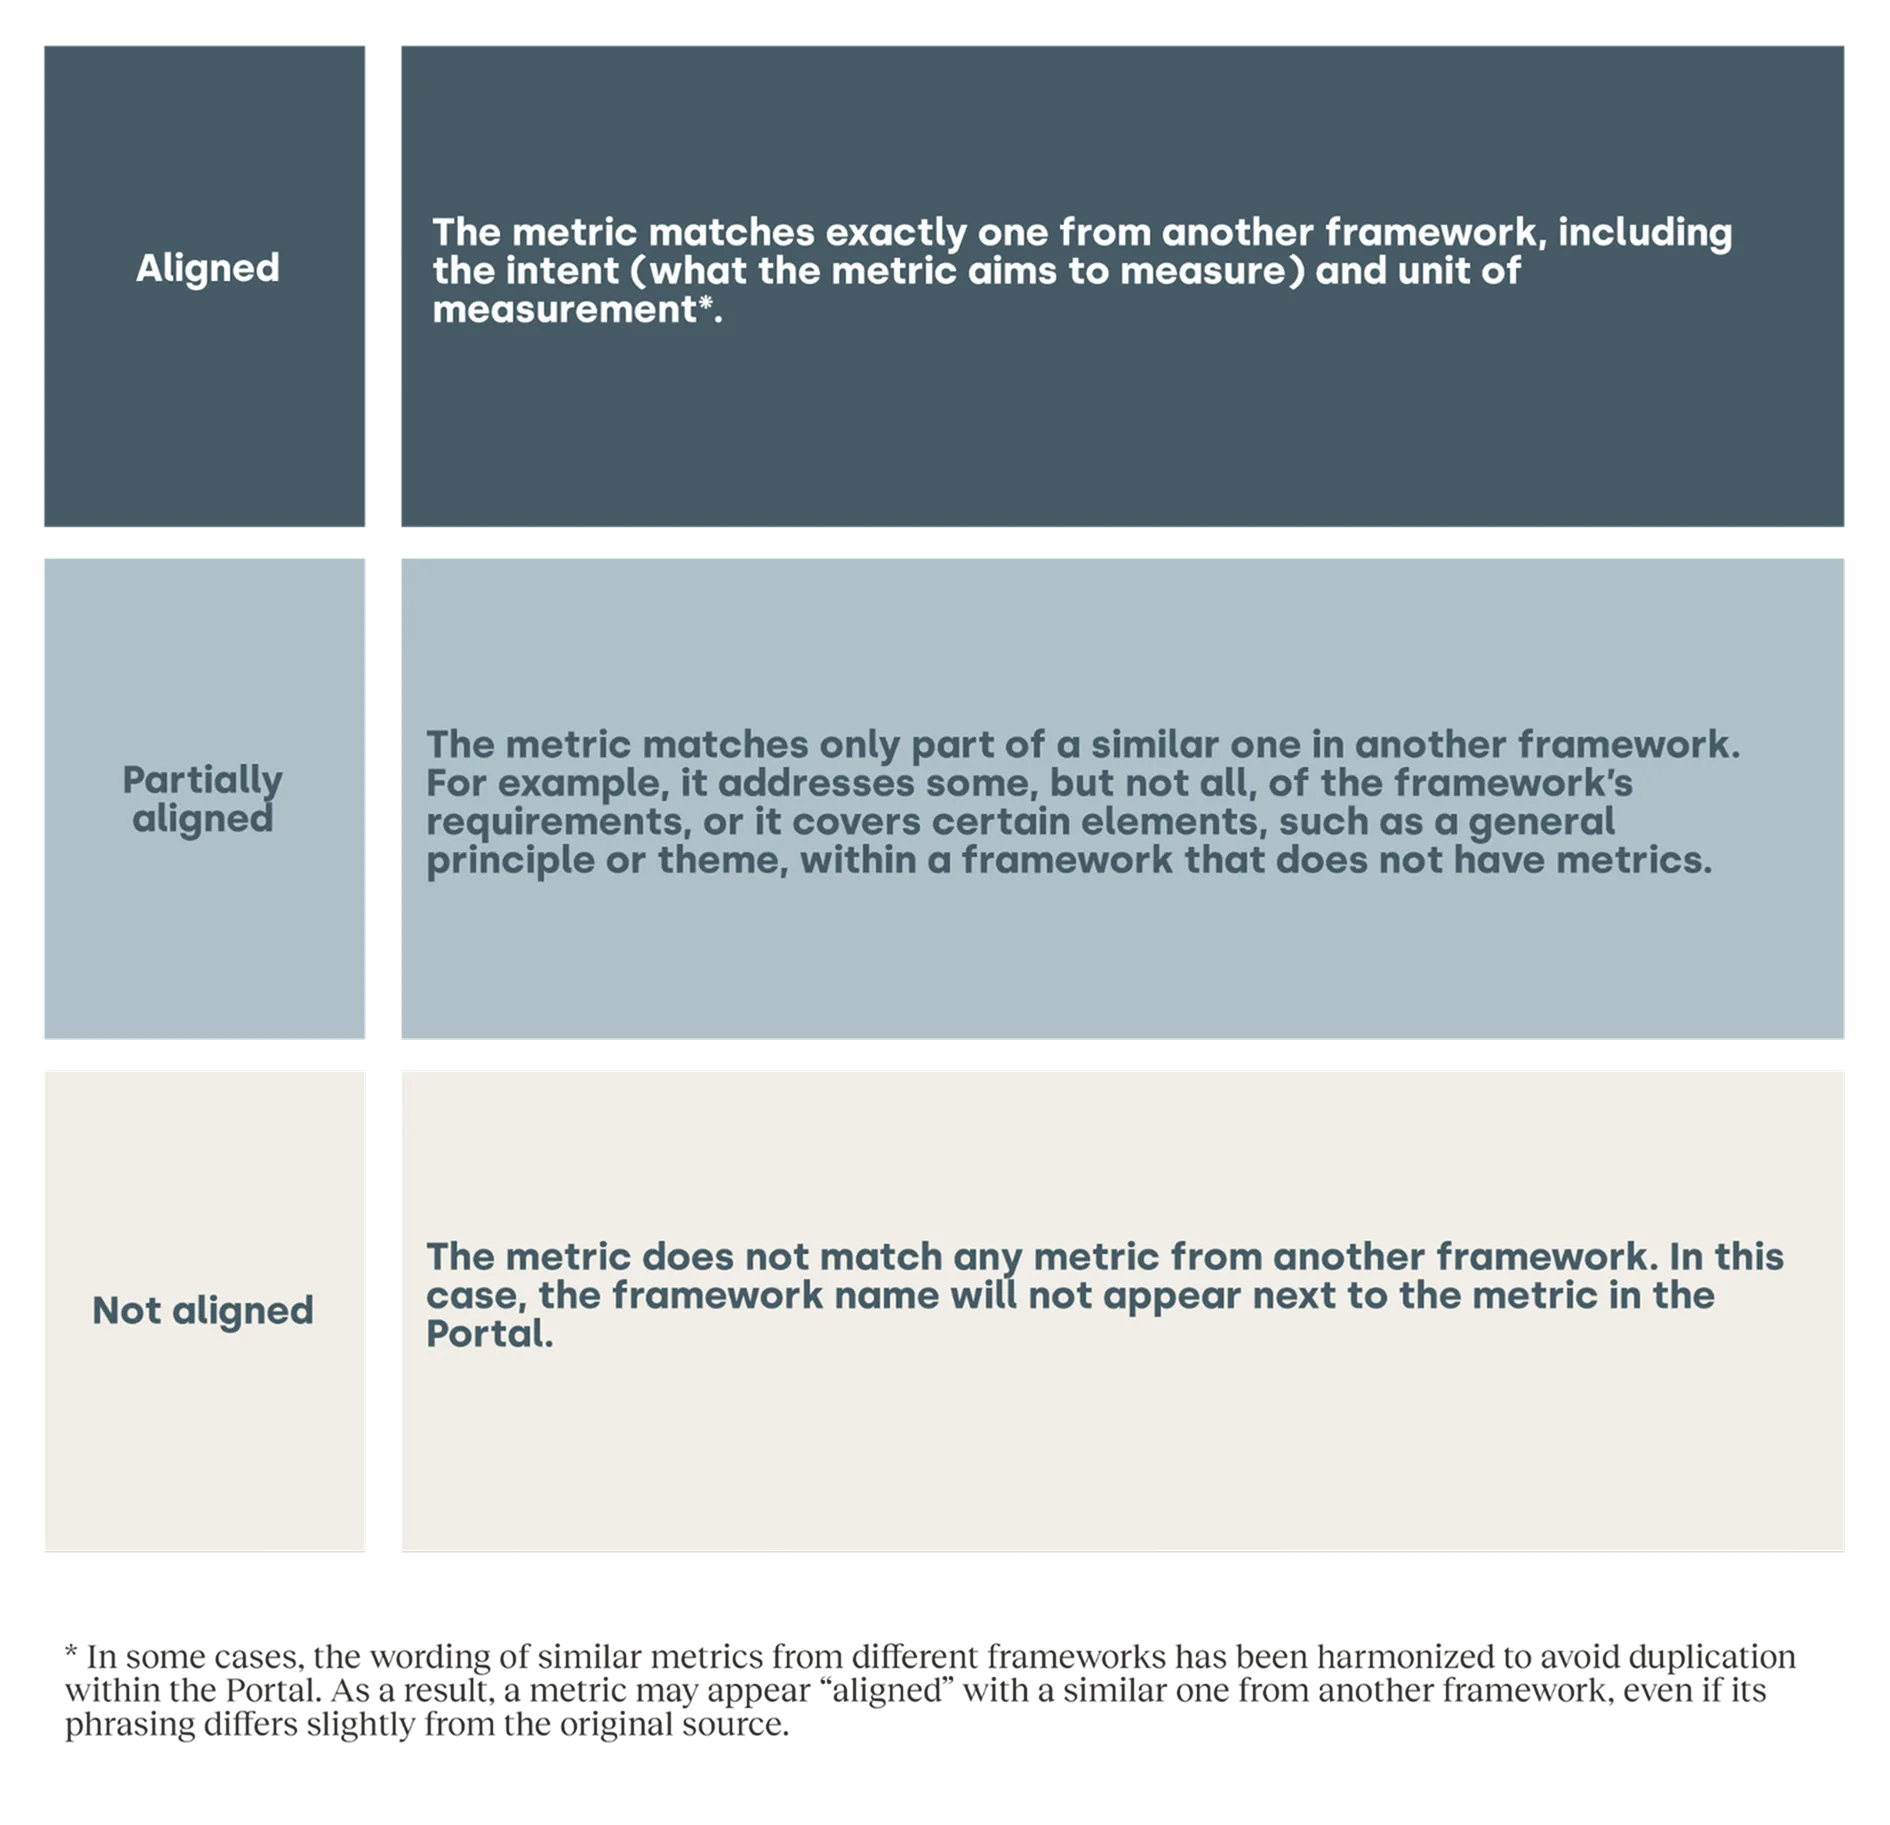
We reviewed the metrics in the Portal for alignment across the most relevant frameworks for the sector. If a metric matches a similar one in other frameworks, it is tagged as “Aligned”. If not, it is tagged as “Partially aligned” or “Not aligned” based on the criteria below.
Assessment criteria for level of alignment of a metric across different frameworks
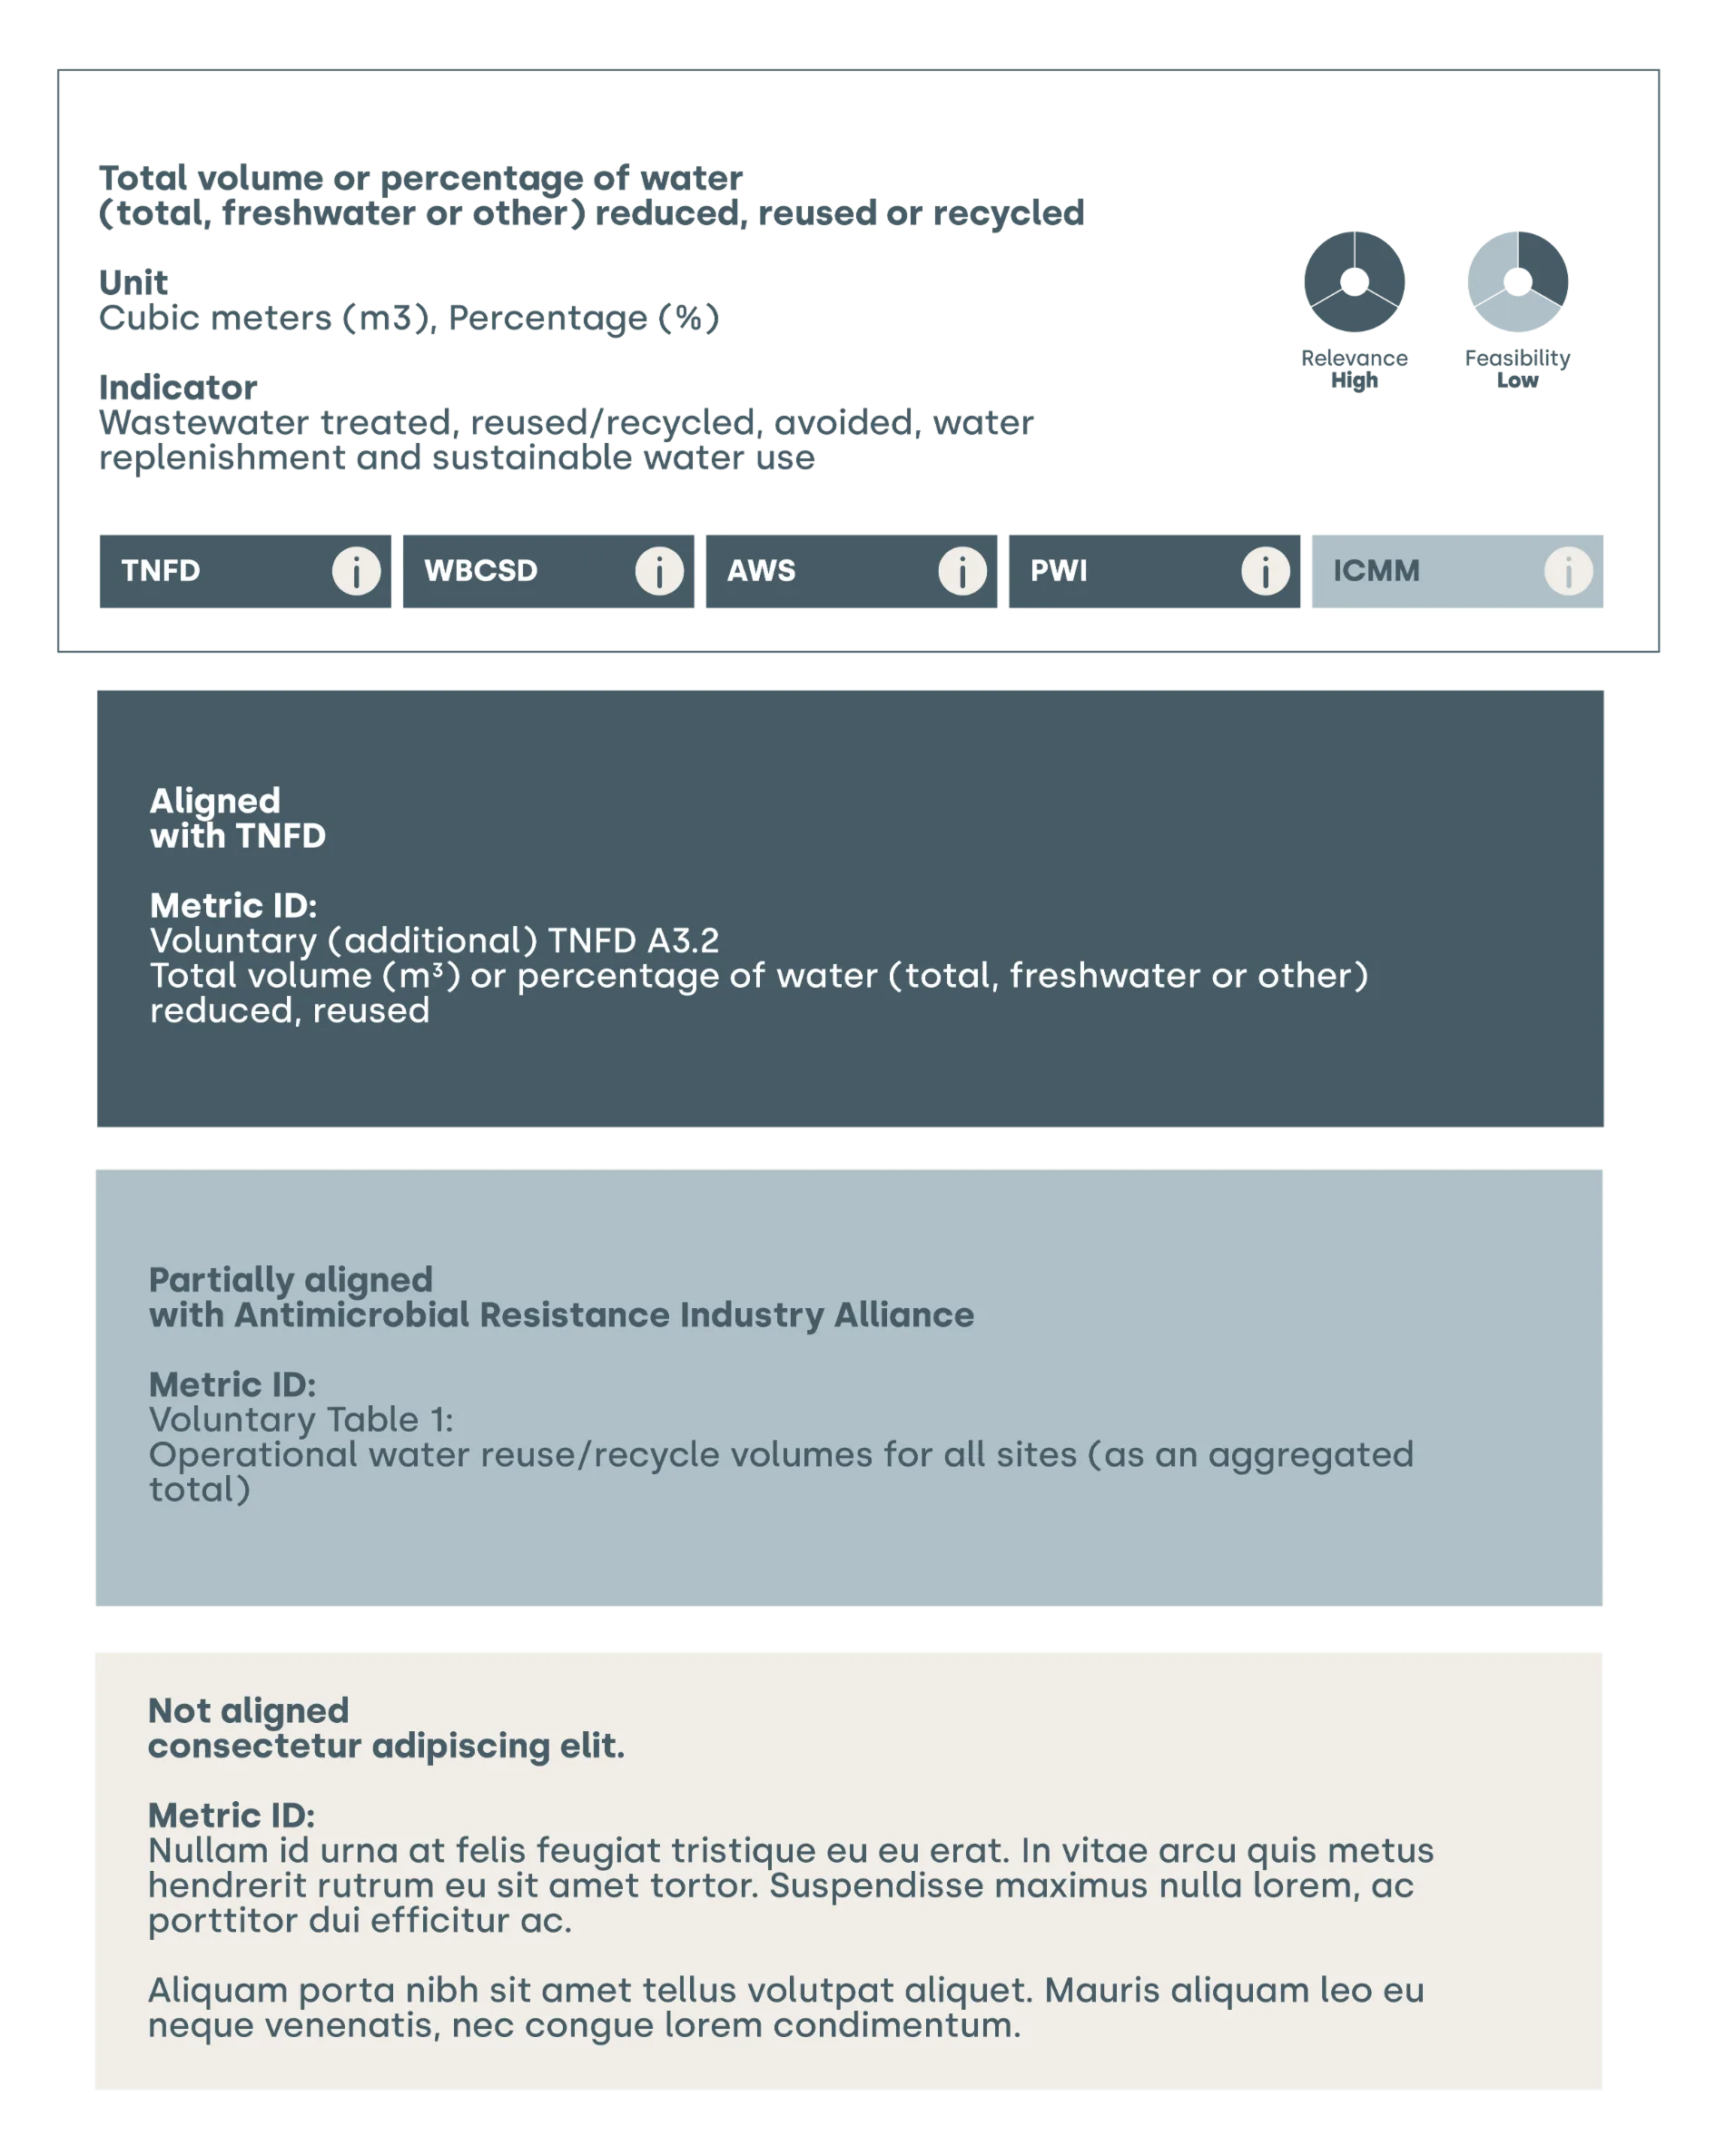
The following figure shows how the alignment assessment appears in the Portal.
Example of an “aligned” metric vs a “partially aligned” metric with those from other frameworks
Important note: The assessment of alignment reflects the status of frameworks, standards and guidance at the time of the assessment. We will update the Portal regularly to reflect the dynamic and fast evolving disclosure landscape.
3) Driving action in the supply chain
Companies encounter challenges in selecting the most relevant metrics to use in their supply chains. This difficulty arises because not all companies have the same level of influence on environmental impacts and outcomes, particularly when they operate several tiers downstream from the source of resource extraction or production (such as a pharmaceutical company sourcing palm oil derivatives).
To address this challenge, we convened a working group comprising 24 companies operating in the forest product and agri-food supply chains to assess existing practices and highlight some of the challenges related to the use of nature-related metrics and setting place-based targets.
Insights into nature-related metrics and target-setting along the value chain captures the outcomes from this process. It calls for greater recognition of these specific challenges by regulators and standard-setters and for more detailed and prescriptive guidance to enhance efficiency and strengthen accountability across the full supply chain.
As an outcome of this process, the Portal incorporates a supply chain viewpoint. The aim is twofold:
- Help companies identify the most material dependencies and impacts in their supply chain;
- Find actions and metrics to support and incentivize supplier action.
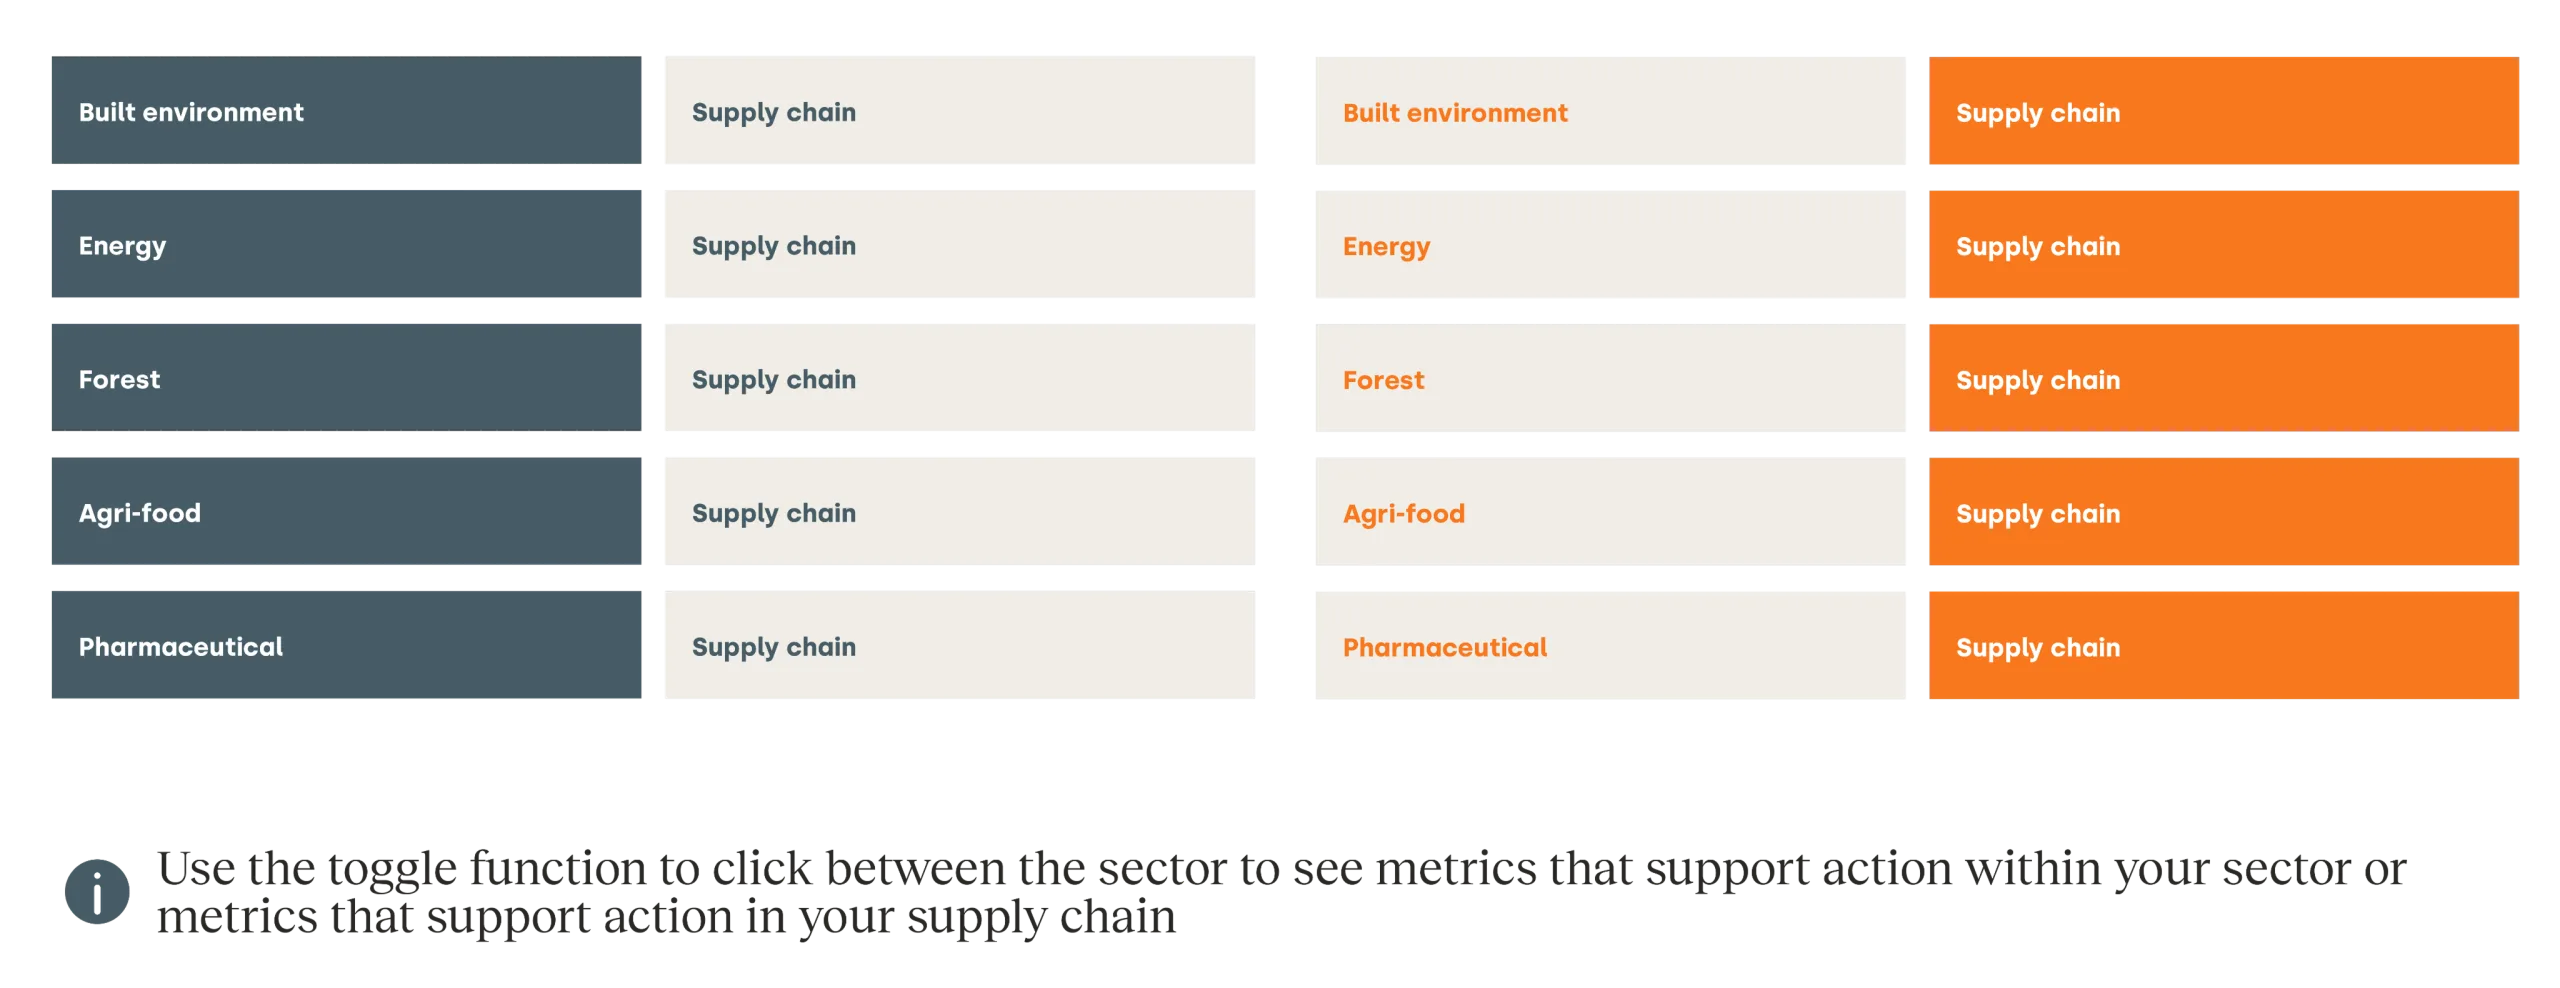
Sector versus supply chain viewpoint in the Portal
The Portal’s current supply chain scope covers only the forest sector and agri-food system, as:
- Bio-based products from these industries play a central role in the transition to a nature-positive economy
- They feed into many other sectors and systems.
We will expand the Portal’s supply chain coverage over time to include additional materials and sectors.
Companies operating in the pharmaceutical, built environment and energy systems can explore a summary of the top dependencies and impacts associated with the forest and agri-food raw materials that they source.
We draw the actions to halt and reverse nature loss in the agri-food and forest supply chain pages from the sector Roadmaps to Nature Positive for forest products and agri-food. We have adapted them to help companies that source from these sectors to identify actions they can implement in their own operations.
The prioritization of the metrics on the supply chain page use the same general approach as outlined in section 1. Prioritizing metrics.
The original set of metrics draws from the list of metrics previously identified as relevant to the raw materials stages of the forest sector and agri-food system (including state of nature, pressure and response metrics).
The procurement metrics draw from the relevant Frameworks. The working group then assessed the long list of metrics for relevance and feasibility for companies operating downstream and sourcing bio-based products from the forest sector and agri-food system.
4) Defining metrics for target-setting
Target-setting plays a vital role in driving corporate action. By reporting progress on widely recognized priority metrics and targets, companies enable financial institutions and other stakeholders to hold them accountable for their environmental impacts and gain clearer insights into their performance and transition plans.
While corporate nature target-setting is still nascent, early movers are already showing that place-based, science-based targets can be highly effective in driving measurable impact. Although these targets remain the gold standard for companies with mature nature strategies, they should also consider other levels of target-setting – at the company, product or supply chain level.
To support target-setting at different levels, the Portal links metrics to relevant targets from the Science Based Targets Network (SBTN) or the Global Biodiversity Framework (GBF). When this is not possible, the Portal provides an illustrative target example, without thresholds.
Companies can adapt these illustrative targets to be measurable, location-based, baseline-referenced and timebound. The examples in the Portal demonstrate how metrics can support robust and credible science-based targets for nature, but they are not intended as target-setting guidance.
Target sources included in the Portal
| Target source in the Portal | Framework source |
|---|---|
| Adapted from SBTN Land Target | SBTN Land Targets Land Technical Guidance V1 and Land Technical Guidance V2 (draft for public consultation) were referenced |
| Adapted from SBTN Freshwater Target | SBTN Freshwater Targets Freshwater Technical Guidance V1.1 was referenced. |
| Adapted from GBF Target 6 | Global Biodiversity Framework |
| WBCSD target template | Refer to the WBCSD target template section below. |
WBCSD target template
The illustrative target examples are available in two formats:
- Mitigation target format: Designed to avoid or reduce negative nature-related impacts, such as land conversion or biodiversity loss, this target format is used primarily for metrics measuring pressures, meaning impacts that companies should aim to mitigate/avoid.
- Positive impact target format: Aimed at increasing or improving nature, such as restoring degraded ecosystems or enhancing species abundance, this target format is used for metrics measuring the state of nature or responses, meaning where companies are aiming to increase or improve the outcome/activities.
Example of mitigation and positive impact targets proposed in the Portal

Disclaimer
The Nature Action Portal was developed in the name of WBCSD. Like other WBCSD resources, it is the result of collaborative efforts by representatives from member companies and external experts. A wide range of member companies reviewed the content, and thus, the content broadly represents the perspective of WBCSD membership. Input and feedback from external stakeholders was also incorporated via open stakeholder consultation sessions and review periods held throughout the content development process for the Roadmaps and the Portal. This does not mean, however, that every member company or stakeholder agrees with every word. The content has been developed for general informational purposes only and is not intended to be relied upon as accounting, tax, legal or other professional advice. For a full list of WBCSD members involved in the development of the content please see the Acknowledgements page.
ENCORE reference
ENCORE Partners (Global Canopy, UNEP FI, and UNEP-WCMC) (2024). ENCORE: Exploring Natural Capital Opportunities, Risks and Exposure. [On-line], [July 2024], Cambridge, UK: the ENCORE Partners. Available at: https://encorenature.org. DOI: https://doi.org/10.34892/dz3x-y059.