By using shared outcomes and indicators, the industry can accelerate regenerative practices at scale – making change real, measurable and rewarding.
Driving private-sector alignment to measure, report and reward regenerative agriculture impact.
Regenerative agriculture restores ecosystems, builds healthy soils and strengthens resilient, competitive food systems. Without a shared way to measure and report outcomes, progress is hard to track, compare and scale. Aligning on key outcomes in regenerative agriculture provides a common language to guide businesses, investors and policymakers. It helps turn isolated efforts into coordinated action and measurable impact.
Measure Progress
across environmental, social and economic outcomes
Align Action
across farms, supply chains and corporate reporting
Scale Impact
to benefit ecosystems, communities and global food systems
By using shared outcomes and indicators, the industry can accelerate regenerative practices at scale – making change real, measurable and rewarding.
WBCSD and One Planet Business for Biodiversity (OP2B) coalition worked together over a two year period to strengthen corporate performance and accountability on climate, nature and equity. Working closely with key partners to align on a core set of cross-sectoral regenerative agriculture outcomes in line with planetary boundaries, the UN SDGs and leading sustainability and disclosure frameworks.
Outcomes and indicators were identified through analysis of existing frameworks* and refined through scientific review and expert deep-dives. This provides a practical, credible foundation for consistent measurement and reporting, helping unlock coordinated public and private investment at scale.
*GHG P-LSR, SBTi FLAG, TCFD, GRI, IFRS, CSRD, CDP, SBTN Land, CDP Forests, TNFD, GRI 304 Biodiversity & Agri Standards, ISSB (based on CDSB Biodiversity), GRI 303 Water, SBTN Freshwater
Global Businesses
Business-Focused Initiatives
Multistakeholder Ecosystem Alignment
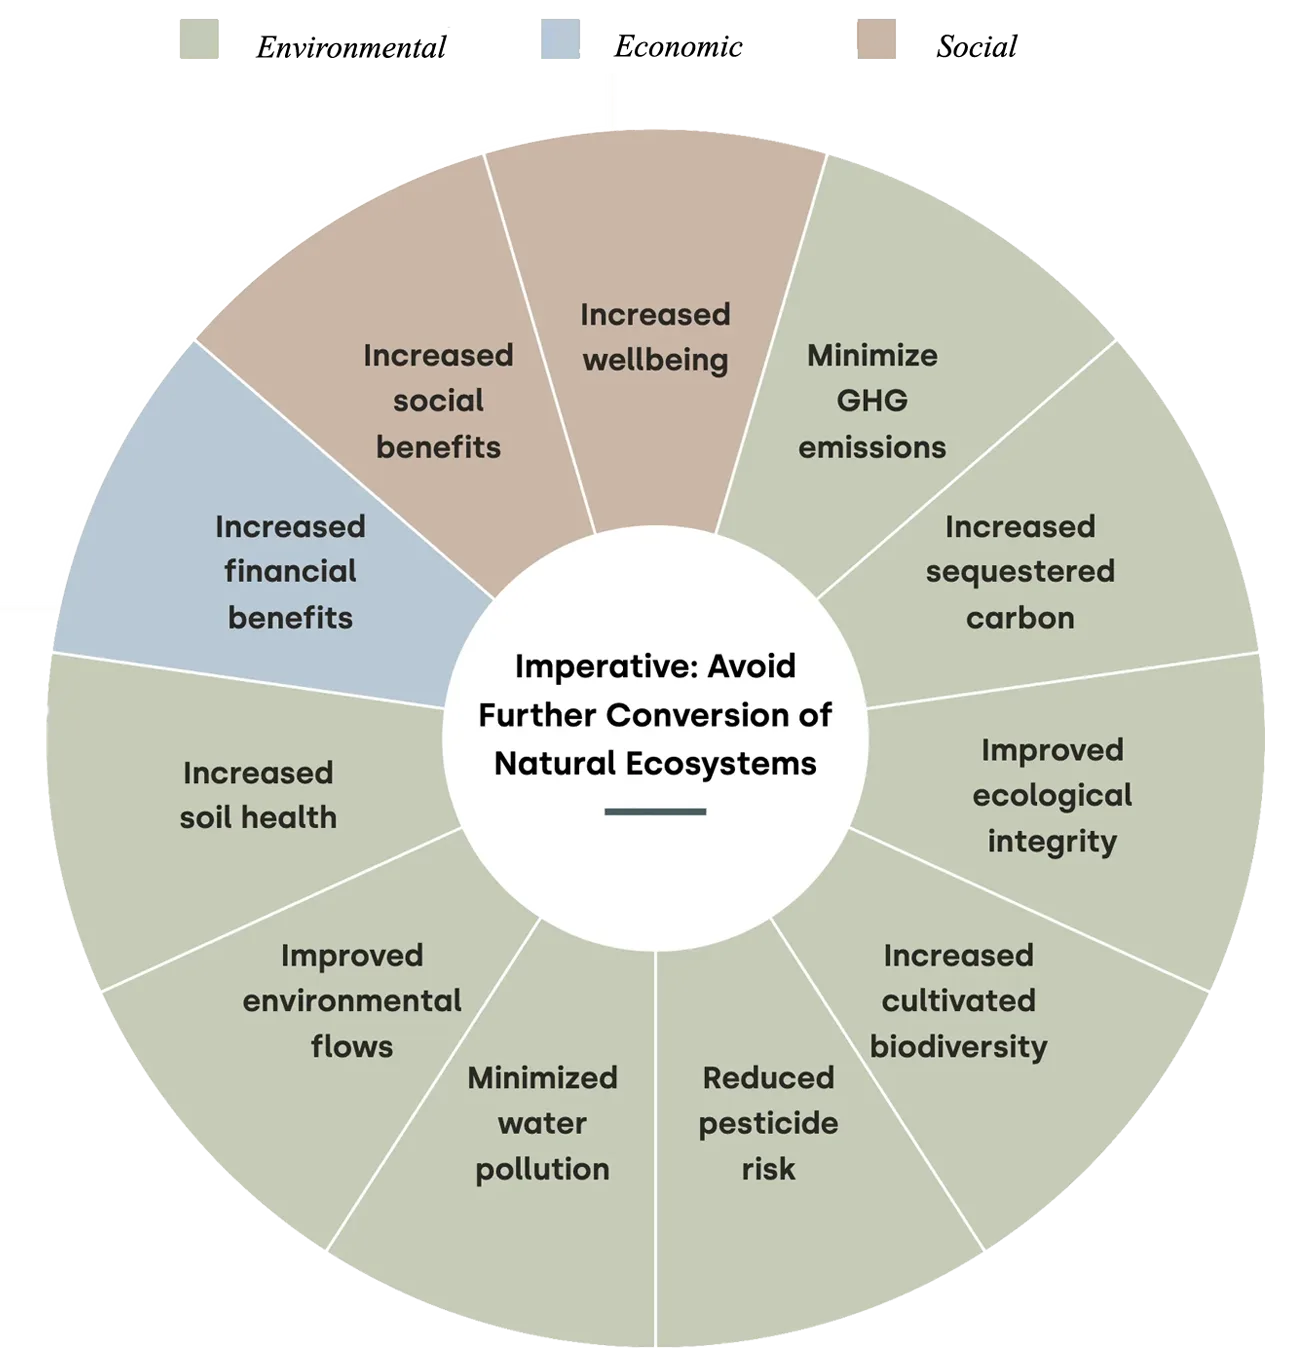
Leading private sector actors and partners are increasingly taking action and calling for a holistic approach to regenerative agriculture that encompasses environmental, social and economic outcomes.
Our collective vision for regenerative agriculture includes 11 cross-sectoral outcomes, aligned with key sustainability frameworks, planetary boundaries and UN SDGs.
This approach accelerates regenerative agriculture among stakeholders, strengthens corporate accountability, enhances supply chain resilience and enables financing that supports farming communities.
Minimize Greenhouse Gas Emissions
| Indicator | Metric |
| Greenhouse gas emissions | MT CO2 e/yield or metric ton of product |
| MT CO2 e total |
Increased Sequestered Carbon
| Indicator | Metric |
| Total carbon sequestration | MT CO2 e total |
| Soil carbon sequestration | MT CO2 e total |
Improved Ecological Integrity
| Indicator | Metric |
| Natural/ restored habitat in agricultural landscapes | Natural/semi-natural habitat (NSH) in agricultural land (% per km2) |
| Indicator | Metric |
| Natural/ restored habitat in agricultural landscapes | Configuration of habitat: → Connectance index → Proportion of NSH core area → Field border density |
| Presence/abundance of priority species | Farms where priority species are stable or increasing in abundance (% of farms) |
Increased Cultivated Biodiversity
| Indicator | Metric |
| Crop diversity | Crop diversity per km2 (modification of the Hill-Shannon Diversity Index) |
| Indicator | Metric |
| Crop diversity | Soil water holding capacity (%) ([volume of water/total volume of saturated soil] x 100) |
Reduced Pesticide Risk
| Indicator | Metric |
| Pesticide risk | Environmental Impact Quotient field-use rating (EIQ score ecological component x application rate) |
Minimized Water Pollution
| Indicator | Metric |
| Nutrient loss | Nutrient use efficiency (%) |
| Indicator | Metric |
| Nutrient loss | Nutrient loss at edge of field (kg/ ha) |
| Loading of nitrogen (N) and phosphorus (P) to receiving water bodies (kg/month/ha) | |
| Total suspended solids | TSS of receiving water bodies (mg/L) |
Improved Environmental Flows
| Indicator | Metric |
| Blue water | Blue water withdrawal (m3/ha) split by level of water stress risk |
| Indicator | Metric |
| Blue water | Blue water withdrawal (m3/ha) aligned with environmental flows |
| Water consumption or Evapotranspiration (m3/ha) | |
| Green water | Soil water holding capacity (%) ([volume of water/total volume of saturated soil] x 100) |
Increased Soil Health
| Indicator | Metric |
| Soil organic carbon | MT CO2e total [Core climate metric] |
| SOC/Area or tons of carbon/ha | |
| Green water | Soil water holding capacity (%) [Additional water metric] |
| Infiltration rate | mm/hr |
| Bulk density | Dry weight of soil in a given volume, g/cm3 |
| Availability of soil nutrients to plants | Amount (mg/kg) of plant available macro/ micronutrient in soil sample (N, P, K, SOM) |
| Soil invertebrate diversity | Species richness and abundance of macroinvertebrates (incl. earthworms where relevant) |
| Soil microbial diversity | Microbial biomass |
| DNA-based metrics | |
| Soil erosion | Tons/ha |
| % bare ground cover |
Increased Financial Benefits
| Indicator | Metric |
| Farm net income | Farm net income (LCU) / ha / year |
| Indicator | Metric |
| Farm net income | % of farm households that meet or are above the living income benchmark |
| ROI (profit / ha) – including yield, input prices and crop prices | |
| Farm worker remuneration | % of farm workers whose remuneration (LCU) meets or is above the living wage benchmark |
| Farm economic resilience | Inter-year variability of farm net income (LUC) / ha (5-year rolling average) |
Increased Social Benefits
| Indicator | Metric |
| Food security | % of farm households classified as food secure (i.e., that do not fall within the moderate or severe food insecurity categories) in the past 12 months |
| Mental health | % of farmers reporting moderate to high well-being (i.e. > threshold |
Increased Wellbeing
| Indicator | Metric |
| Food security | % of farm households classified as food secure (i.e., that do not fall within the moderate or severe food insecurity categories) in the past 12 months |
| Mental health | % of farmers reporting moderate to high well-being (i.e. > threshold |
Companies worldwide are already leveraging these outcomes at both corporate and landscape levels, accelerating the transition to more competitive, sustainable and resilient food systems worldwide.
holistic outcomes aligned
businesses engaged directly and indirectly
businesses aligned on outcomes
partners operating in the ecosystem united
Evidence of Momentum Across the Agri-Food Sector
Measurement, Reporting and Verification (MRV): Enabling Alignment and Scale
Collective Action in High-Impact Landscapes


What is regenerative agriculture and how does it work?
What are the key principles of regenerative agriculture?
How does regenerative agriculture differ from organic, sustainable or conservation agriculture?
What is the connection between WBCSD's private sector alignment, SAI platform and Regen10 initiative?
How aligned is WBCSD's private sector alignment with other sector specific frameworks?
How does regenerative agriculture positively impact communities?
Glossary
| Above- and below-ground carbon sequestration | Increasing the uptake of CO2 and storage of carbon in biological sinks.24 Includes carbon stored in the carbon pools of specific habitats, such as trees, above-ground biomass, roots and soil. |
| Above-ground biomass carbon pool | Carbon in terrestrial living woody or herbaceous vegetation 2mm in size or greater. Example: carbon in trees, shrubs, plants. |
| Agroforestry | Growing trees and shrubs with crops and/or animals in interacting combinations on the same unit of land. |
| Below-ground biomass carbon pool | Carbon in terrestrial live roots 2 mm in size or greater. Example: carbon in roots. |
| Biodiversity | According to IPBES, “The variability among living organisms from all sources including terrestrial, marine and other aquatic ecosystems and the ecological complexes of which they are a part. This includes variation in genetic, phenotypic, phylogenetic, and functional attributes, as well as changes in abundance and distribution over time and space within and among species, biological communities and ecosystems. |
| Bulk density | The density of a volume of soil as it exists naturally, it includes air space, organic matter, and soil solids. |
| Blue water | Rivers, lakes, reservoirs and renewable groundwater stores. |
| CO2 equivalent (CO2-e) | The universal unit of measurement to indicate the global warming potential (GWP) of each of the six greenhouse gases, expressed in terms of the GWP of one unit of carbon dioxide. It is used to evaluate releasing (or avoiding releasing) different greenhouse gases against a common basis. |
| Ecosystem services | According to IPBES, “A service that is provided by an ecosystem as an intrinsic property of its functionality (e.g. pollination, nutrient cycling, nitrogen fixation, fruit and seed dispersal). The benefits (and occasionally disbenefits) that people obtain from ecosystems. These include provisioning services such as food and water; regulating services such as flood and disease control; and cultural services such as recreation and sense of place. In the original definition of the Millennium Ecosystem Assessment the concept of ecosystem goods and services is synonymous with ecosystem services |
| Emissions scopes | The GHG Protocol classifies a company’s GHG emissions into three scopes. Scope 1 emissions are direct emissions from owned or controlled sources. Scope 2 emissions are indirect emissions from the generation of purchased energy. Scope 3 emissions are all indirect emissions (not included in scope 2) that occur in the value chain of the reporting company, including both upstream and downstream emissions. |
| Environmental flows | The quantity, timing and quality of water needed for functioning ecosystems. |
| Green water | Terrestrial precipitation, evaporation and soil moisture. |
| Indicators | Values or characteristics that provide insight into a particular phenomenon or situation. |
| Natural habitat | According to IPBES, “Areas composed of viable assemblages of plant and/or animal species of largely native origin and/or where human activity had not essentially modified an area's primary ecological functions and species composition. |
| Natural or semi-natural habitat | A habitat within or outside a crop made up of a community of primarily native, non-crop plant species, which human activity may modify but is able to contribute to enhanced ecosystem services. |
| Metrics | System or unit of measurements |
| Planetary boundaries | Those considered indicators of healthy agroecological systems that can help to maintain the functioning of key ecosystem services. This can include taxa of importance for ecosystem services provision, functionally important groups or indicator species of ecosystem integrity. |
| Riparian buffer | Riparian refers to an area along a stream or riverbank. A riparian buffer is essential to preserving water quality on farmland. |
| Soil carbon pool | → Mineral soil organic carbon (SOC): Carbon in soil organic matter that is smaller than 2 mm in size in soil types not classified as organic soils. Example: carbon in topsoil of croplands from particulate organic matter or microbial biomass. → Organic SOC: Carbon in soil organic matter that is smaller than 2 mm in size in organic soils that have organic horizon >10 cm or which have greater than 12-20% organic carbon by weight. Example: carbon in peat soils or wetland organic soils. |
| Soil inorganic carbon | Carbon in soil carbonates and other mineral carbon forms. Example: carbon in calcium carbonates in desert soils. |
| Soil organic carbon (SOC) | Soil organic carbon is the carbon component of soil organic matter. |
| Soil organic matter (SOM) | Any material produced originally by living organisms that is within or returned to the soil. It is composed of soil microorganisms such as bacteria and fungi as well as decaying material from once-living organisms and fecal material. |
| State-pressure-response framework | State of nature Refers to measures of the direct state of the environment in three categories: the state of ecosystems (extent and condition), species (abundance and extinction risk) and ecosystem services (or the state of nature’s contribution to people). Pressure Human activities that directly or indirectly change the state of the environment and ecosystem. Following the Intergovernmental Science-Policy Platform on Biodiversity and Ecosystem Services (IPBES),57 five key pressures contribute most to the loss of nature globally: land- and sea-use change, direct exploitation of organisms, climate change, pollution and invasion of alien species. Response Actions taken by companies or farmers to address pressures or to improve the state of nature on farmed land. |
| Total suspended solids (TSS) | The overall mass of particles suspended in a water sample. The TSS are usually captured by a filter during sampling. This is distinct from total dissolved solids, which measures the dissolved fraction. |
| Outcomes | Quantitative or qualitative parameters that measure achievement or reflect changes over time; may be short or long term. |
| Water consumption | Sum of all water withdrawn and incorporated into products, used in the production of crops or generated as waste, has evaporated, transpired or been consumed by humans or livestock, or is polluted to the point of being unusable by other users and is therefore not released back to surface water, groundwater, seawater or a third party over the course of the reporting period. |
| Water discharge | Sum of effluents, used water and unused water released to surface water, groundwater, seawater or a third party, for which the organization has no further use, over the course of the reporting period. |
| Water withdrawal | Sum of all water drawn from surface water, groundwater, seawater or a third party for any use over the course of the reporting period. |