OP2B Regeneration Map

The OP2B Regeneration Map is designed to identify new opportunities for private sector collaboration in multi-stakeholder landscape projects in Europe, while also illustrating ongoing investments and progress on regeneration, conservation and restoration. The map reveals where collaboration gaps exist and where coordinated action can deliver the strongest ecological and economic impact for farming communities. 

Explore the OP2B Regenerative Map

Collaborative action at landscape scale is essential to build resilient European agriculture 

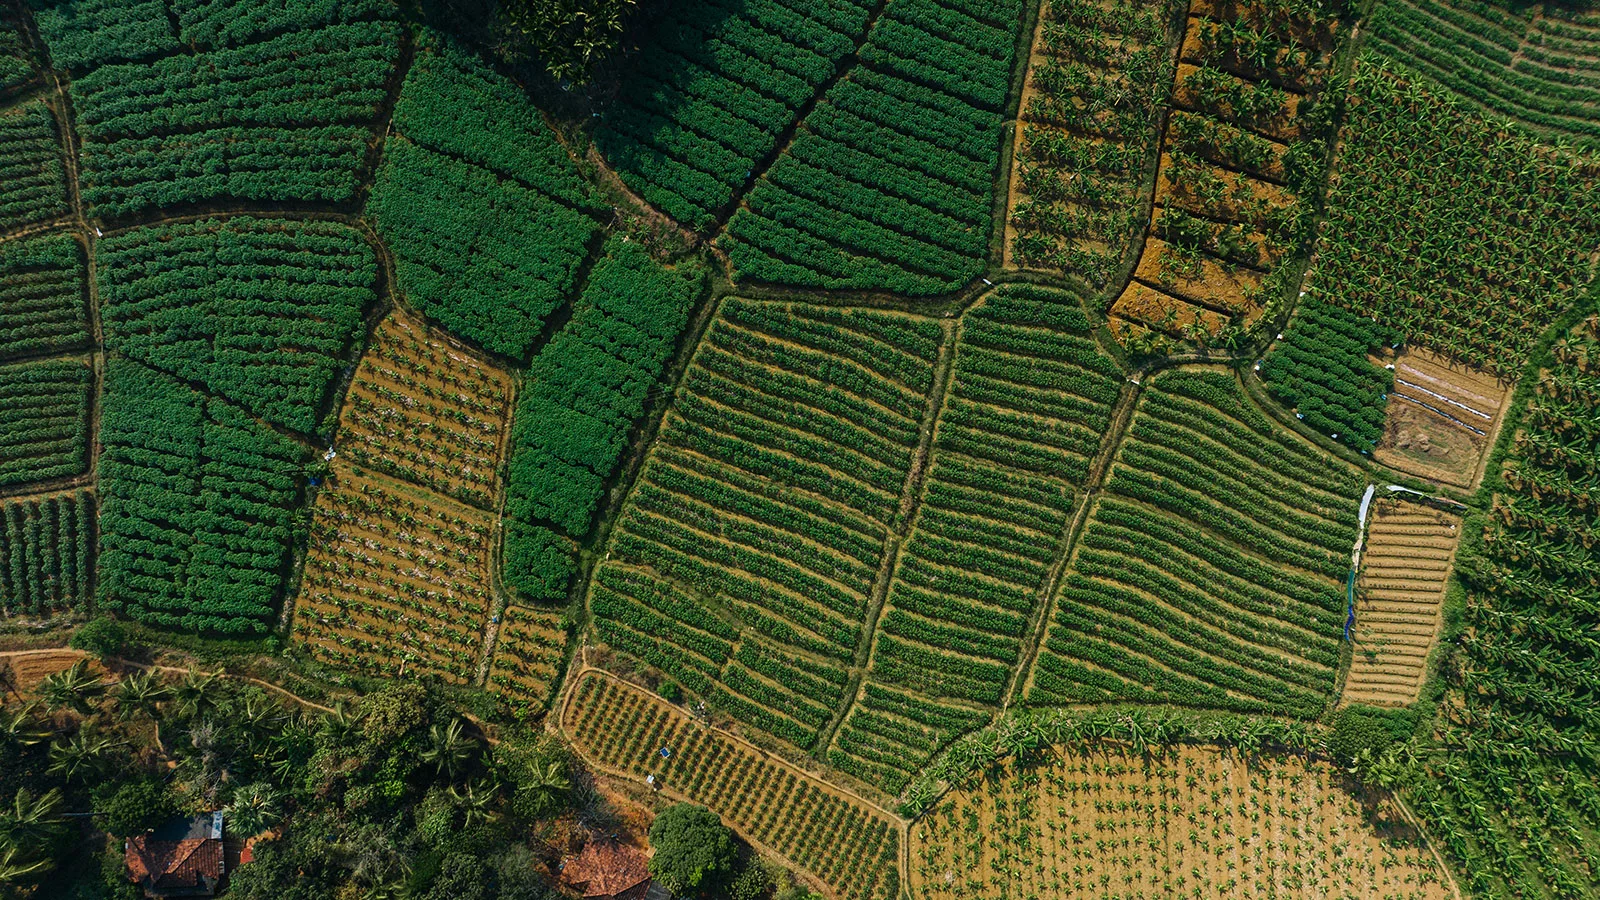
Today, two-thirds of European soils are degraded, with an estimated cost of €50 billion per year and annual yield losses amounting to approximately €28.3 billion. Combined with input price shocks and the increasing frequency of extreme weather events, this means that Europe’s agricultural production is under growing pressure 

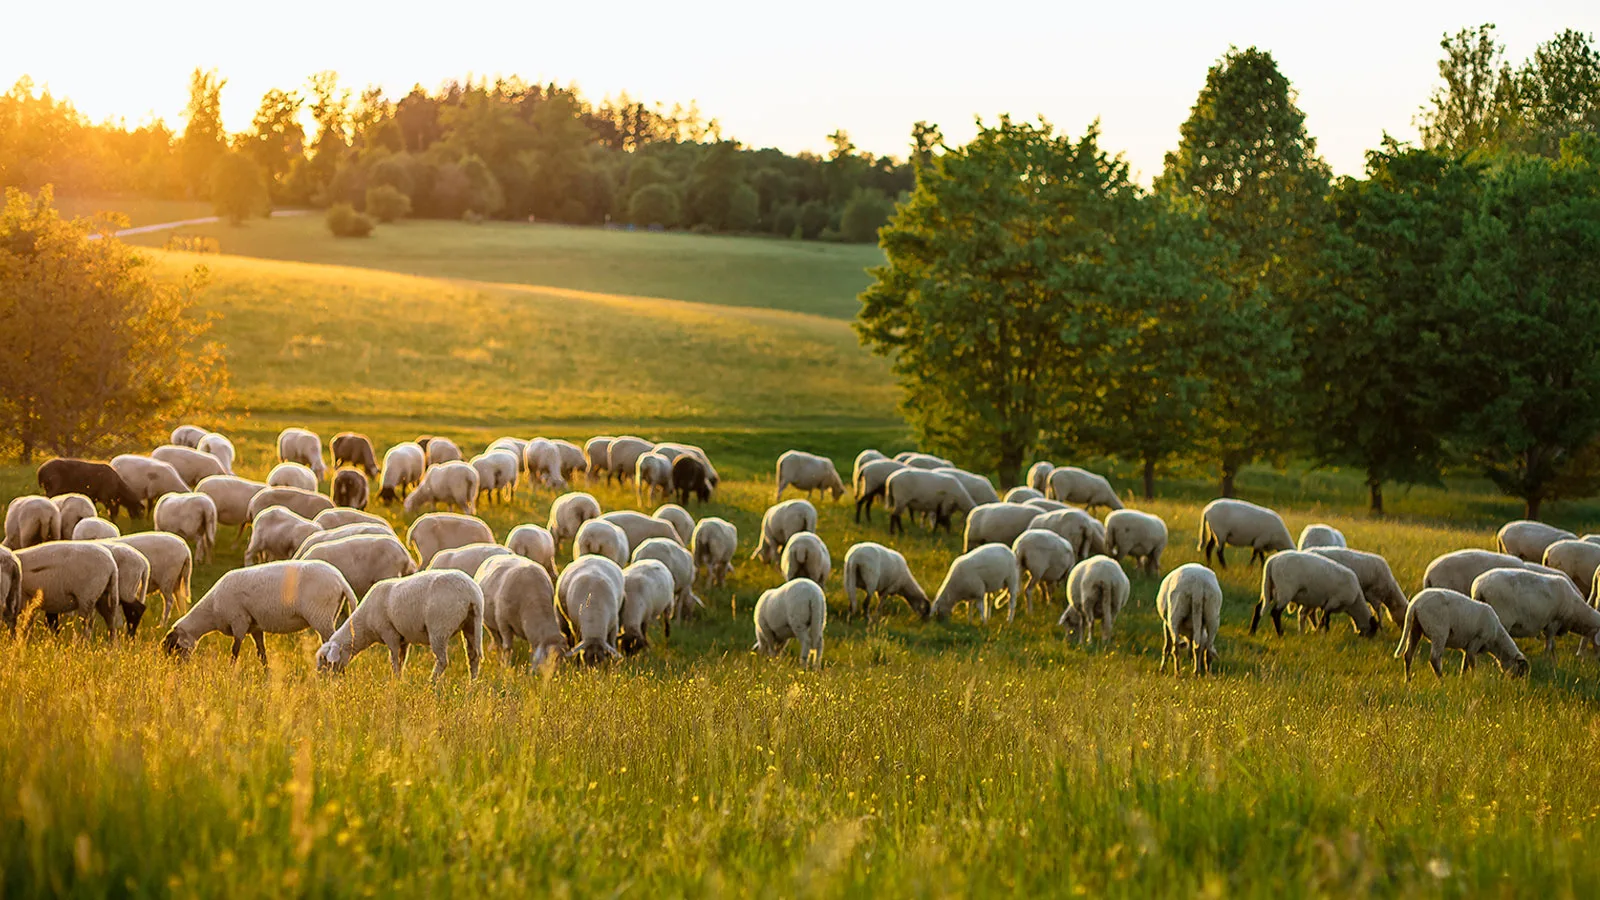
Regenerative agriculture restores ecosystems, builds healthy soils and strengthens resilient, competitive agricultural systems. Beyond its ecological benefits, regenerative agriculture also creates economic opportunities across the value chain. For farmers, it opens access to premium markets, carbon credits, and ecosystem services payments. For companies, it strengthens supply resilience, reduces climate-related risks, and supports sustainability commitments.

Learn more about the business case for regenerative agriculture

  • Regenerative agriculture outcomes: explore how regenerative practices deliver measurable benefits across environmental, social and economic dimensions
  • Closing the investment gap: understand the financial case for the regenerative agriculture transition and the gap in incentives available in Europe
  • Cultivating farmer prosperity: learn about farmers’ perspectives on transitioning to regenerative agriculture

  • However, only about 15% of cropland is managed under regenerative practices. The fragmentation of efforts and investments hinders meaningful impact at scale. The OP2B Regeneration Map addresses this fragmentation by bringing together over 160 initiatives in regenerative agriculture, conservation, restoration, and nature-based solutions such as agroforestry, river and wetland management, forest diversification, ecosystem-based water management, with existing or potential corporate investment. Projects included cover both productive and non-productive land, underscoring the need for businesses to connect the wellbeing of ecosystems to value chain resilience. The tool maps project locations, contextualizing them with thematic layers highlighting risks and opportunities present in each landscape, and provides decision-useful information related to projects’ scale, implementation, outcomes, and value creation model.


    The OP2B Regeneration Map aims to enable the scaling of impactful projects by highlighting opportunities for business to invest in resilience through existing collaborative projects.

Explore the range of regenerative agriculture and nature-based practices implemented across landscapes in the OP2B Regeneration Map

Agroforestry, biodiversity-enhancing practices, companion crops, cover crops, crop rotation, hedgerows, improved pasture management, improved water management, integrated pest management (IPM), intercropping, mechanical weeding, nutrient management optimization, organic fertilization, precision farming, reduced fuel use, reduced synthetic inputs, reduced/no tillage, reforestation, rotational grazing, soil cover management ecosystem restoration, species reintroduction & natural processes, landscape connectivity, landscape management & risk reduction, sustainable land-use planning, ecosystem-based water & catchment management, local community engagement, afforestation

What the OP2B Regeneration Map shows

<p><b><span data-contrast="auto"> Curated project overview</span></b></p>

1. Curated project overview

A curated dataset of over 130 regenerative agriculture initiatives and 30 conservation, restoration, and nature-based solutions projects across Europe, with existing or potential corporate engagement. 

<p><strong> Detailed insights </strong></p>
<p> </p>

2. Detailed insights   

Detailed information on each project — including goods sourced within the project, partners involved, size (e.g. hectares, farmers, or farms involved), investment models, and monitoring, reporting, and verification (MRV) systems.

<p><strong> Filterable dataset </strong></p>

3. Filterable dataset 

Filter projects by goods, size, activity type, and project status to identify relevant opportunities.

<p><strong> Agroecological thematic layers</strong></p>

4. Agroecological thematic layers

A diverse set of satellite-based layers presents agroecological characteristics and environmental risks across Europe, including biodiversity intactness, restoration opportunities and land use.

Who the OP2B Regeneration Map is for

For OP2B members and other value chain actors, the Regeneration Map provides strategic visibility on where business priorities intersect with landscape opportunities, enabling informed decisions that can support farmers through structured transition pathways.

For policymakers and EU institutions, it highlights where instruments such as the Common Agricultural Policy (CAP) or the EU Carbon Removal Certification Framework (CRCF) can crowd in private capital to reinforce farmer incentives and de-risk adoption of regenerative practices.

For financial institutions, it creates transparency on landscape-scale opportunities supported by aggregated value chain engagement and governance structures that increase confidence in long-term farmer outcomes.

For project implementers and farmer organizations, it increases visibility with companies and financiers and clarifies pathways for coordinated co-financing within their territory.

Transparency and Visibility  

The OP2B Regeneration Map provides a structured overview of ongoing initiatives, supporting transparent communication of regeneration, conservation, restoration and nature-based solution efforts across Europe. The Regeneration Map is unique as it brings together nature-based solutions databases with regenerative agriculture data – complemented by partner efforts such as those by Foodvalley – creating a comprehensive view of investments in productive and non-productive land. 

If you would like to contribute to the map and explore partnership opportunities, please reach out to the OP2B Secretariat via Martina Asquini.  

Methodology:

To build the OP2B Regeneration Map, we combined desk research from publicly available sources — including press releases, project pages, sustainability reports, and nature-based solutions databases — with AI-supported data processing and internal validation to transform diverse and unstandardized information into a consistent and comparable dataset. In selected cases, additional input was provided by OP2B members and implementation partners. This map is developed by OP2B, but OP2B is not directly involved in the projects aggregated through it.

Standardization framework

To ensure comparability across projects, all information was organized into a unified structure covering key elements such as project characteristics, partnerships, geographic scope, goods, regenerative practices, monitored outcomes, size, and investment approaches. Where information was not disclosed, fields were left unreported.

Agroecological landscapes

In addition to project-level data, the map integrates spatial data thematic layers to help users situate projects in their agroecological contexts. These include global datasets such as restoration opportunities, soil carbon density, land use and biodiversity intactness, alongside other environmental indicators. These layers help users better understand the characteristics, risks, and restoration potential of different regions, supporting more informed exploration and decision-making. Detailed information about data sources and methodologies is available via the Library through the information button. For instance, UNEP-WCMC has developed the Restoration Opportunities data layer allowing companies to screen for locations that offer opportunities for the delivery of multiple benefits through ecosystem restoration in Europe. This layer is intended to be used alongside other data as part of screening and scoping exercises and should be validated on-ground as appropriate.